Rails and Discourse Startup Times

I've spent a lot of time benchmarking how fast Discourse handles HTTP requests with various Ruby versions, to see how much new Ruby fixes help Rails speed. But I haven't looked yet at startup time, which can be very important for Rails apps. Specifically, I'm looking at time to handle first request. It's not the only definition of "startup time," but I think it's a very useful one.

Using a "real world" benchmark with Discourse, a production Rails app, makes for a few challenges. Specifically, Ruby, Rails and Discourse are all independently changing. It's not a synthetic benchmark app, it's a real app with a real user base and it only works with certain specific Ruby versions (and a single Rails version) at any given time.

There are only a few Discourse versions with compatibility from Ruby 2.0.X through 2.3.X. I'm using v1.5.0. Then we'll look at Discourse v1.8.0 (basically up-to-date) for Ruby 2.3.4 and 2.4.0, since current Discourse only supports very recent Ruby.

Older Ruby, Older Discourse

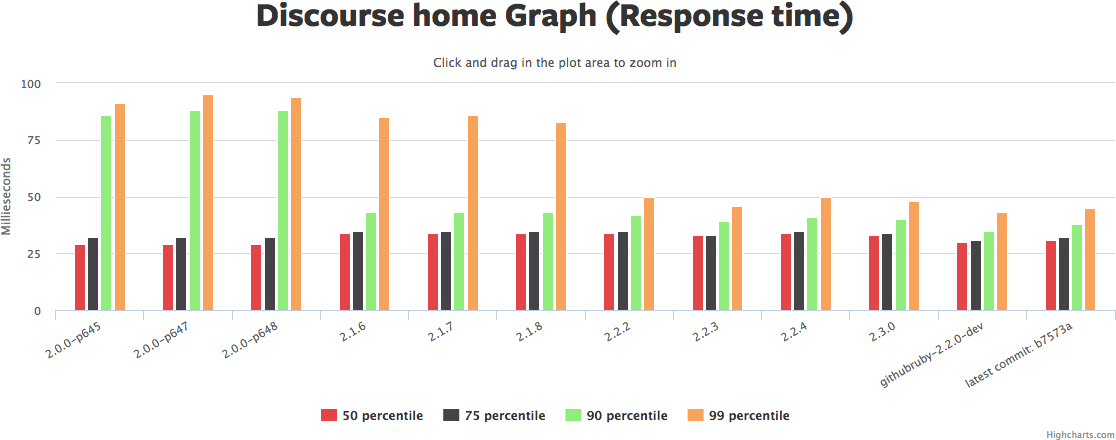
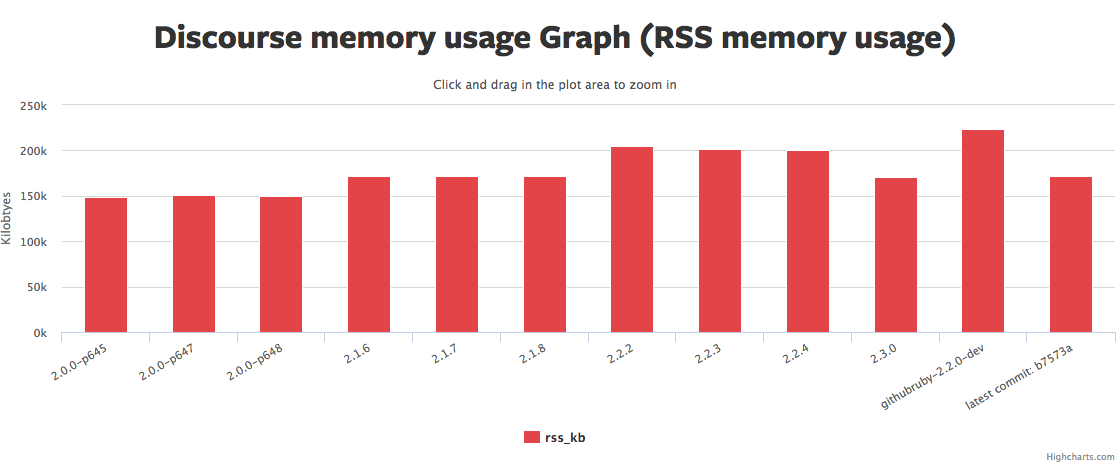
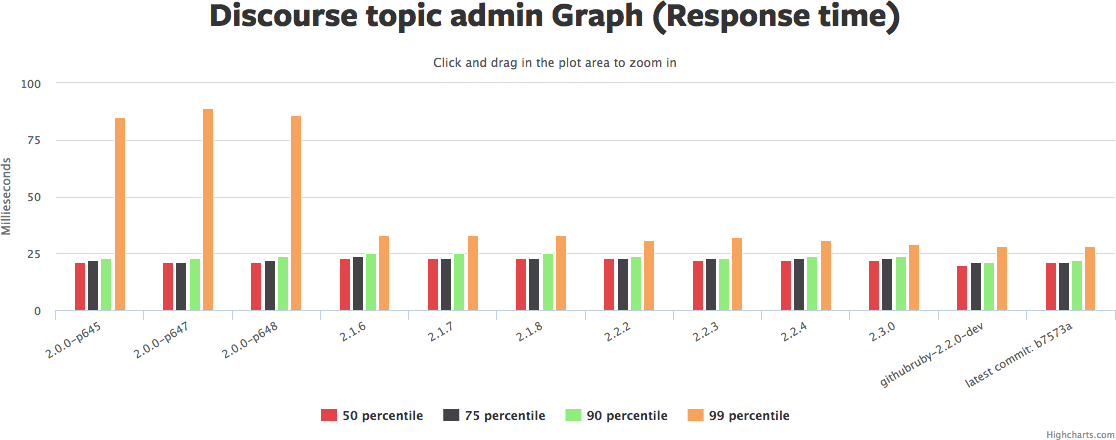
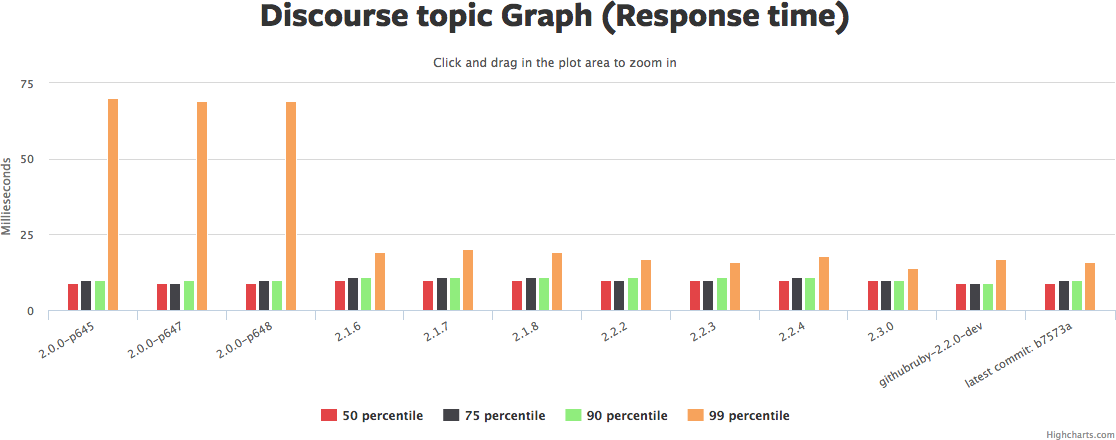
Using Discourse v1.5.0, we see nice clean numbers for startup time - very low variance, very consistent, and speeding up from older Ruby to newer Ruby. As always, feel free to request my JSON data for my results, and the benchmark code is all open.

Discourse startup times get better by increasing Ruby version, and by Discourse version.

Discourse startup times get better by increasing Ruby version, and by Discourse version.

Overall, Discourse 1.5.0 time-to-first request drops from 9.9 seconds with Ruby 2.0.0 to 7.7 seconds with Ruby 2.3.4. That's a 23.3% improvement. Then switching from Discourse 1.5.0 to 1.8.0 on Ruby 2.3.4 improves startup time to 6.5 seconds, or about a 15% speedup from Discourse improvements. And then Ruby 2.4.1 drops startup time to 5.85 seconds, or another 10% speedup.

So overall, Discourse delivers a 15% startup-time speedup from 1.5.0 to 1.8.0, and Ruby delivers a 30% startup-time speedup from 2.0.0 to 2.4.1. Not too shabby!

Future Goodness

None of this takes Bootsnap into account, which apparently drops Discourse startup time by half. Bootsnap is a complex beast, but mostly it works through a combination of caching filesystem checks in the require path and pre-parsing your Ruby code and caching the result.

Bootsnap is scheduled to be standard in every Rails app Gemfile for all new Rails apps, starting some time around Rails 5.0.

So for those following along at home, we expect the 30% Ruby-based startup-time improvement and the 15% Discourse-based startup improvement to be joined by a 50% startup-time improvement in Rails itself. Stay tuned.

Methodology and Picky Details

With only minor tweaks and improvements, this is the same benchmark I've been using for most of my Ruby benchmarking.

The tested Discourse v1.8.0beta13 AMI is public: "ami-f678218d".

The tested Discourse v1.5.0 AMI is also public: "ami-554a4543".

Discourse v1.8.0beta13 was chosen for a combination of Ruby compatibility and benchmark compatibility - there are some changes to Discourse which haven't yet been reflected in Rails Ruby Bench which currently prevent testing with the latest versions. I believe that will be fixed soon, but in the mean time I'm testing with v1.8.0beta13. I have no current reason to believe that this makes a significant difference in speed, or especially in the difference in speed between Ruby 2.3 and 2.4. Should I find problems in the methodology, you should expect them to be published on this blog.

"Time to first request" is measured by dispatching HTTP requests in a tight loop with a short sleep in between. There are a number of interesting variables which could be changed - startup currently is done with many workers and threads, for instance, and it could certainly be faster with fewer of them, though I think it would be less typical of real-world usage. RRB specifically and explicitly aims to be a "production, real-world" benchmark, and so startup time is measured with many threads and workers. The sleep in the loop will eventually be a problem for precision if Rails startup time improves by around 3x-4x. Should that happen, I'll decrease the duration of the sleep or remove it. For now, the sleep is short enough in duration not to cause a precision problem, but long enough to allow the Rails app to handle end-of-request work seamlessly and keep latency low. You can see the measurement logic in start.rb.

Rails' startup time for a large application like Discourse with complex startup logic is not necessarily the same as for a "vanilla" freshly-created Rails app with minimal startup complexity. Indeed, I have seen specific cases where an optimization will improve the "vanilla" startup time while making Discourse startup time worse. My intent is to measure both of those separately so that we can see the impact by Rails version on both. This article only covers the Discourse/complex/production case, not the plain-Rails/vanilla/simple case.


Improving the bundle size of Reactstrap from 295kB to 84kB

At AppFolio we use open source software to build parts of our product. As we spend time fine-tuning the performance of our products, we also end up finding possible improvements in the open source packages that we use. By contributing the improvements back to the projects, we are able to have others in the open source community benefit from the work that we do, everybody profits.

In this post I’ll focus on one of such contributions: the migration of Reactstrap from using Webpack 1 to using Rollup. Reactstrap is an implementation of the Bootstrap 4 components in React.

The migration of Reactstrap from Webpack 1 to Rollup has two major effects: it reduces the bundle size of the library significantly and allows for publishing a distribution that preserves ES2015 "import" and "export" statements. The module-based version is great for applications that depend on Reactstrap because it enables tree-shaking. Tree-shaking is a feature of Rollup and of Webpack 2+ that removes unused dependencies from your bundle. So if you use 3 components from Reactstrap, you will only ship 3 components to your users instead of all 72 components.

There are two ways to consume Reactstrap: You either import it in your JavaScript code or you reference Reactstrap directly from your HTML page. After analyzing the builds, we noticed issues with both ways.

Bundling for CommonJS

Reactstrap is shipped as ES5-compatible JavaScript but is written in a more modern version of JavaScript. It uses Babel to transpile the source code to be ES5-compatible.

The “main” entry in your package.json file defines the entry point of your module. The entry point is loaded when a user depends on your package.

For a release, Reactstrap would transpile the source code file for file into ES5-compatible code, without bundling them into a single file. For example, the component "src/Button.js" will now be available in ES5 as "lib/Button.js". No bundler would be involved. It then set the entry point to "lib/index.js" and left the bundling up to whatever the consumer of Reactstrap wanted to do.

This approach comes with a big cost for the file size. Because files are transpiled one file at a time, Babel will include helper functions to support new JavaScript functionality in each file. Since "lib/index.js" imports all dependencies, you will end up with the helpers being included once per component!

As a lot of the non-interactive components in Reactstrap are very small, it could add as much as 35% to the file size to individual components. Take for example "lib/CardDeck.js", it’s 1.62kB. The helpers here include "_extends", "_interopRequireDefault" and "_objectWithoutProperties". They add up together to 577 bytes of the overall size of the file.

The first step in solving this is to set the entry point of Reactstrap to point at a bundled version of the source code. This bundle still depends on the same dependencies but now has been transformed by Rollup into a single flat file. This is the same approach that gave React 16 a 10% reduction in bundle size and a 9% boost in startup speed. (source)

The next step is to configure our bundler to handle the helpers correctly. For this we can use the external helpers Babel plugin to prevent the helpers from being added to each file. The Babel plugin for Rollup will take care of injecting the helpers as a single block at the top of the bundle.

A nice touch by Rich Harris is that the Babel plugin for Rollup will warn you if you forget to use the external helpers Babel plugin.

Since Reactstrap currently contains 72 components, we have just saved around 36kB by deduplicating the helpers and have improved performance by shipping a flat bundle.

The UMD build

Reactstrap also includes a UMD build for consumers that reference the code directly via a script tag from their HTML page. The UMD build of Reactstrap 4.3.0 is 295kB. That’s big!

If we sum up all the unminified transpiled component sizes, we get to 213kB. So how is it possible that a minified and bundled version is even bigger than that?

To dig into this, we use a tool called source-map-explorer. This tool will allow you to inspect any JavaScript file with associated source map and see the contribution of each source file to the size. It shows as a treemap visualization so the bigger the rectangle, the more space it takes up.

Treemap visualization of the Reactstrap 4.3.0 UMD bundle - interactive HTML page

By looking at the generated treemap, the cause of the file size is easy to spot: both React and React DOM are included, contributing 140kB to the file size. Both React and React DOM are marked as external in the Reactstrap Webpack configuration but it looks like it was slightly misconfigured, causing both React and React DOM to be bundled inside Reactstrap too!

We corrected this in the Rollup config, saving another 140kB.

Bonus: Replacing big dependencies

While observing the source map, we also noticed that the package lodash.omit takes up 9.29kB. That’s a lot of space for a utility function. It looks like the unminified lodash.omit v3 was 2.31kB but it jumped to 37.76kB in lodash.omit v4. After looking at how it was used inside Reactstrap, we were able to write our own function that minifies to just 105 bytes, saving another 9kB.

On a side note, we also experimented with trying to import the lodash functions directly from the lodash package and have tree-shaking remove the ones we don’t use. This did not reduce the bundle size (PR). This is due to Rollup having to be conservative in which parts of code it removes (see Rollup wiki for more info).

Conclusion

Configuring your bundler is easy to get wrong. An incorrectly configured bundler might be difficult to spot because your tests can still pass and your users can still be happy.

In the case of Reactstrap, once correctly configured, we managed to reduce the bundle size from 295kB to 84kB. That being said, the biggest benefit for most people will actually be the module based build which will allow them to cherry-pick only the components they need into their own bundle!

Note: if you are the author of a JavaScript library and are using Webpack, consider migrating to Rollup to allow module-based builds (blog post by the authors of Webpack and Rollup). A good starting point will be the Reactstrap rollup config.

Thanks to Chris LaRose, Gary Thomas and Damon Valenzona for giving feedback on the article.
 

A Story of Passion and Hash Tables

Ruby 2.4.0 introduced a lot of great new features. One of them was open addressing for hash tables - the details of open addressing are a bit obscure, but Ruby hash tables are now faster. Everybody uses hash tables, so everybody gets extra speed. Awesome!

But how did that happen? There's an interesting story there. Let's tell that story and benchmark with Rails Ruby Bench, shall we? (Don't care about the story? Scroll down to the end for graphs of the speed differences.)

A Beginning and Some Dueling Banjos

Ruby's open addressing for hash tables is recorded by a truly wonderful bug report. If you don't care about my commentary, just go read it. Seriously.

It begins with Vladimir Makarov proposing open addressing for Ruby's hash tables and including a patch. Open addressing is a better match for modern multilevel CPU caches than Ruby's previous method. That was very nice of him. Thank you, Vladimir! (Here's his explanation of the hash table changes.)

Is that the end of the story? Not so much.

Koichi points out that his very first patch wasn't perfect, and increased memory usage in some cases (true.) Nobu and Yura Sokolov (funny_falcon) point out some other minor problems. Feedback happens, especially with a large patch, or one that touches very common functionality like hash tables.

Vladimir responded, more back-and-forth ensued, and funny_falcon continued to engage more and talk about how he'd have done it (he didn't think open addressing was necessary, for instance, and that he could get similar results without it.) Vladimir responded to him. There was a highly-technical argument, mostly good-natured, going strong. And eventually less good-natured. It's easy for tempers to run hot in technical discussions -- I do the same thing, and they clearly understood what was going on. Isn't it wonderful to watch engineers doing what they feel passionate about, showing that they care but also acknowledging that we all want the same thing? I love watching that.

If you have time, read through the whole thread. The back-and-forth is wonderful, and highly educational -- "you should use quadratic probing," "here's the wikipedia article for...," "I disagree that this should be int32," "test large inserts, does the time grow linearly?" It's not just a great deep dive into hash tables. It's a great study in passionate disagreement between highly skilled engineers.

It also involved Vladimir and Yura proposing and counter-proposing patches with different good and bad points, back and forth, and critiquing each other's code constantly. Who had the better hash table implementation?

Eventually Shyouhei and Koichi (prominent core Ruby committers) looked over the results and checked for errors. The patches continued to improve, and the edge cases kept getting fixed. Either Yura's or Vladimir's patch might win. Each had taken tricks from the other.

Nearly-final patches were prepared. Decisions were made about features like maximum hash size. Evaluations continued and intensified. Fixes were made. Yura's patch eventually adopted open addressing, and the two patches were very similar...

Koichi put together some great benchmarks and a wonderfully comprehensive report - and basically said the implementations were so close you could pick between them with a coin toss.

Speed versus table size of different hash tables, from Koichi's report.

Speed versus table size of different hash tables, from Koichi's report.

And even then, the patches and improvements didn't stop. Not from either of the participants.

And in the end, as the deadline loomed, Vladimir's version was chosen. There was a graceful acknowledgement by Vladimir, a touch of grumbling by funny_falcon and then a graceful concession -- after putting months into his own version, I'm impressed and grateful that Yura conceded. It's a very hard thing to do. And Ruby hash tables came out much better for the competition. He did us all a great service.

And it appears that Vladimir enjoyed his time modifying Ruby - he's recently put together a whole new Ruby VM, still in early development, that significantly improves overall speed! Unfortunately, it's not ready to run Rails yet so I can't measure it with Rails Ruby Bench. Soon, perhaps?

How To Measure?

I thought, "I'll check how much faster the patch is using my Discourse-based Ruby benchmark!" Koichi, like the built-in Discourse benchmarks, tends to microbenchmark by testing the same URLs many times, while my benchmark tries to simulate a realistic, varied, highly-concurrent workload.

Trying out my benchmark for this, I discovered... Oh, right. Discourse isn't compatible with that range of prerelease 2.4.0-series Rubies. Oops.

Soon I realized: I can patch the latest prerelease Ruby to remove open-addressing hash tables and go back to the old closed-addressing code. Then I can check the two against each other!

Of course, it's never quite that easy. The hash table code has changed a few more times since then. But eventually it worked nicely. You can see the code I used here. So: the comparison below isn't pre-2.4.0 before and after the hash patch. Instead, it's current prerelease Ruby, and that same Ruby plus a patch to use old-style closed addressing hash tables again. That patch is the only code difference between the two Rubies.

It works, though! As before, this benchmark uses a multithreaded load-test program, a vigorously multiprocess and multithreaded Puma and Discourse, running flat-out on an EC2 m4.2xlarge dedicated instance.

I've doubled the number of HTTP requests per run from 1500 to 3000. With newer Ruby and Rails versions, the benchmark runs quite quickly, and some randomness and slowdowns that were "in the noise" are now big enough to see in my graphs. Running more requests is giving me more predictable results in return for a bit more CPU time.

How Fast?

Like my previous articles, I used a mixed grouping of Discourse HTTP requests. The per-request speedup is subtle enough to be hard to see:

Yes, all the right-hand bars are a little lower at every percentile. No, not much lower. so: new-style hash tables improve each request, but not by a huge amount.

Yes, all the right-hand bars are a little lower at every percentile. No, not much lower. so: new-style hash tables improve each request, but not by a huge amount.

I can see the difference in the full thread runtimes better. Perhaps you can too:

This is how long it takes for 100 consecutive requests. The per-request speedup adds up. These are the shortest, median and longest times to process 100 requests during a benchmark run. Left side are old-style closed addressing hash results, right a…

This is how long it takes for 100 consecutive requests. The per-request speedup adds up. These are the shortest, median and longest times to process 100 requests during a benchmark run. Left side are old-style closed addressing hash results, right are open-addressing.

The median request with closed addressing (old-style) hash tables takes 0.134 seconds, and the 90th percentile takes 0.371 seconds (see below.) With open addressing, that's 0.127 median and 0.355 for the 90th percentile. In both cases, that's about a 5% speedup -- not for just the hash operations, but for the entire Rails request time. That's not bad.

The median run with closed addressing hash tables takes 17.312 seconds, and the 90th percentile takes 17.95 seconds. With open addressing it's 16.577 median and 17.417 for the 90th percentile. That's also around 5% speedup, give or take.

MetricClosedOpen
Median Req0.1340.127
90th Pct Req0.3710.355
Median Full Run17.31216.577
90th Pct Full Run17.95017.417

(As always, feel free to request my JSON data files, or to spin up an m4.2xlarge dedicated instance with the benchmark code and try for yourself.)

Conclusions

I started investigating this because I wanted to make sure my benchmark worked and made sense when checking out new Ruby optimizations. So I tried out the Ruby 2.4.0 hash table changes - a case where they really cared about the answer, "does this make a difference for Rails applications?" The short answer is "yes -- these hash table changes speed up a real Rails app by about 5% overall." Which is pretty serious!

The bug report and its story are, of course, a whole saga unto themselves.

Thanks for reading!

How is Ruby Different in Japan?

I've had a few conversations recently where I say things like, "the Japanese Ruby community uses Ruby for different things than in America"... and I get blank stares. Specifically, I mention that America is very centered on Rails and web apps with Ruby. No surprise, right?

"But then," people ask, "if they're not using Ruby for Rails, what do they do with it?"

And why does anybody care? For the same reason I have these conversations. Because the American style of Rails usage lends itself to throwing huge amounts of memory and concurrency at your problems, and the Japanese style of Ruby usage does not. This normally comes up when they ask, "but why can't Ruby just use JIT?" JIT is complex and memory-intensive. It's great for running a web server. It sucks for... Well, let's look at what the Japanese folks do, shall we?

(The wonderful Twitter exchange in response to this post also examines what's up with MRI and JIT. If you're here for the JIT, it's worth a read.)

The Photogenic Zachary Scott and a billboard for "Ruby City Matsue" in Shimane Prefecture, Japan

The Photogenic Zachary Scott and a billboard for "Ruby City Matsue" in Shimane Prefecture, Japan

A Difference in Community

The American Ruby community mostly happened because of Rails. Yes, yes, Ruby had a long and storied history before Rails happened (and yes, it did.) But America finally noticed Ruby because of Rails.

As a result, Ruby's fortunes in America have looked a lot like how Rails is currently doing. Rails rose and Ruby rose. Rails has mostly peaked and is decreasing, and so is Ruby. It's not that Ruby is only used for Rails -- it isn't. But the two have risen and fallen together in the United States, and in most of the English-speaking world.

Japan has looked a little different. Not only was Ruby popular long before Rails came along, Rails wasn't the sort of wildfire in Japan that it had been in America. And now that the tides of Rails are receding and you're seeing fewer American regional Ruby conferences...

Japan has them all over the place, and only increasing in number. Ruby-no-Kai is Japan's version of Ruby Central, and is hosting six or more regional RubyKaigi (Ruby conferences) this year -- just in Japan! Some of the conferences are new, some have met for the last few years, up to 11 years (!) for the older ones. And of course, there's the worldwide RubyKaigi. There is also an enterprise conference, Ruby World. And multiple award conferences: RubyBiz and the Fukuoka Ruby Awards, plus a Ruby Prize at Ruby World. Ruby is still very much growing in Japan. As a fun little aside: Ruby-no-Kai tracks their conferences with a bug tracker. So you can see them there.

Another difference: government sponsorship. Japan is very proud that Ruby was invented in Japan and is still based there. FCOCA, part of Fukuoka Prefecture, sponsored multiple American Ruby tours and a bunch of embedded Ruby work, and a variety of Ruby-based contests and awards. Shimane sponsors Ruby work as well, and has Matsue ("The Ruby City".) There are areas that used to be miniature Silicon Valleys of their own, and their local government is trying to get over that hump with... Ruby. Often, but not always, embedded Ruby and Ruby IoT devices.

That's one reason you see a lot of Japanese government sponsorship for mruby. American audiences often ask, "why would you want an embedded Ruby?" But for the Japanese, it's a lot of how they were already using Ruby. Ruby has great memory usage and embeds pretty well. mruby embeds really well. But embedded Ruby and mruby aren't a big part of the English-speaking Ruby world.

One other major difference in the Japanese Ruby community is how centralized it is. Many of the core contributors like Koichi Sasada, Shyouhei Urabe, Yui Naruse, Zachary Scott and Akira Matsuda live within 10-15 minutes of each other and talk often. Matz, of course, talks to them all regularly, including at regular committer meetings. Their regional conferences are run primarily by one organization, and their sponsorship comes primarily from a few specific sources.

One more point that affects how the core Ruby committers view Ruby technically: Matz is employed full-time by Heroku, and Koichi (author of the current Ruby VM, Director of the Ruby Association) was until recently. Heroku is an American company, owned by SalesForce. But it's also a hosting company, and so its views on memory usage (its biggest expense) versus CPU (often idle, easy to 'move' between VMs) is rather different than an American company hosting Rails on raw EC2 instances. They also really want Ruby to behave well on the smallest Heroku instances, for all sorts of good reasons.

A Japanese Enterprise Ruby Conference

For some other differences, let's look at the program for Ruby World 2016, which happened in Matsue, Shimane, Japan.

The first Ruby World talk was about using Ruby for an in-car electrical control unit testing machine. The second talk was about using embedded mruby to develop applications for embedded hardware. So yes, there's that embedded thing...

The third talk is about Enechange, an electricity price comparison service. That one would have a web site, but it's still not what you'd think of as a typical U.S. Ruby-based startup.

Next is sponsor talks from Hitachi, and from Eiwa System Management. Based on their company page, which mentions "in-vehicle system development of automobiles," I'd guess there is some embedded Ruby-in-cars going on there too.

The following two talks are about Scientific Computing, followed by machine learning infrastructures. Both are useful, and both happen in the English-speaking Ruby world as well, but I see them more from the Japanese Ruby community. On the "Japanese data management" front, Treasure Data is also worth a mention. They're also a significant force in the Japanese Ruby community, and they also employ prominent Ruby folks.

The next Ruby World talk, on learning mruby with Lego MindStorms does sound like something you'd see at an English-language Ruby convention, but it's also embedded. And after a "scaling the company with Ruby" talk from R-learning, an "IT services and support" company, is one called "Tried to start programming class for children in a small town," which again sounds like something you'd see at a Ruby convention in California or New York.

A lot of the other talks are also about the business or practice of development rather than applications of Ruby -- for instance about Agile, DevOps and how to get a job as a developer. And after a sponsor talk from an IoT sensor company focused on sake brewing, there's a sponsor talk from a Rails consultancy. So it's certainly not as if America and Japan use Ruby totally differently.

Same and Different, Different and Same

You'll see some Ruby on Rails in the Japanese community, it's true. But you'll also find that they often use it a bit differently -- like CookPad, which proudly runs the world's largest Rails monolith, basically by using Rails as a CMS. It's conceptually more like WordPress than it is like Twitter.

The Ruby Association, from Google's Street view

The Ruby Association, from Google's Street view

And of course, the English-speaking Ruby world isn't all Rails. You'll find some machine learning and IoT in American Ruby conferences. Presumably Ruby is even running in a car somewhere in America as well. There are definitely liaisons between the Ruby and Rails worlds, like Aaron Patterson, Akira Matsuda and Richard Schneeman. But the overall focus is different.

So: the next time you think, "why isn't Ruby perfectly optimized for Rails and Rails alone?" it's worth remembering the Japanese folks. That's where Ruby comes from. It's where most of the Ruby development happens. And it's a different world, doing different things. There's some Rails, yes. But Rails is a long way from being their whole world.

Many thanks to Zachary Scott, who knows far more about the Japanese Ruby community than I do. He read drafts of this article, suggested many new angles, and helped me see where I'd made some significant mistakes. A lot of the "Difference in Community" section is information he graciously pointed out and I hadn't known.

And many thanks to Matz for Ruby, for mruby, and for corrections to this article about mruby and Heroku!

Rails Speed with Ruby 2.4.0 and Current Discourse

My recent benchmarking blog posts looked at how Rails and Discourse performance changed from Ruby 2.0.X to 2.3.X But they have a glaring, huge omission: they stop at Ruby 2.3.4 and at Discourse 1.5.0 (vintage March 2016.) That covers a lot of the post-Ruby-2.0 performance improvements, but what's changed between 2.3.4 and the latest Ruby?

Unfortunately, the Discourse version we used, 1.5.0, doesn't support Ruby 2.4 or higher. It's a risk with using a real app for benchmarking. New Discourse only supports Ruby 2.3 or 2.4. So: let's look at current Discourse's speed on Ruby 2.3.4 and Ruby's head-of-master in Git.

Runs

As you may remember from previous posts, Rails Ruby Bench runs a series of consecutive requests about as fast as Puma can manage on an EC2 m4.2xlarge dedicated instance. So let's look at comparative times for full runs between Ruby 2.3.4 and 2.5.0 (head-of-master.)

I'm seeing roughly 10%-15% lower time-per-run between runs. from Ruby 2.0.0 to 2.3.4 was about A 30% speedup, so an extra 10% or 15% on top of that isn't bad.

I'm seeing roughly 10%-15% lower time-per-run between runs. from Ruby 2.0.0 to 2.3.4 was about A 30% speedup, so an extra 10% or 15% on top of that isn't bad.

You can also visualize these results as the total change in throughput -- that's the number of requests/second until the slowest load thread finishes, so it emphasizes the longest-running requests:

This is also around 10% to 15% speedup. It's based on exactly the same numbers, so that's no surprise.

This is also around 10% to 15% speedup. It's based on exactly the same numbers, so that's no surprise.


And finally, let's look at individual request times. You may recall from previous comparisons that different Ruby versions have different effects on the fastest and slowest requests -- so let's compare 2.3.4 to 2.5.0 by various request speeds...

As with earlier transitions, everything slow speeds up. You can't see sub-median requests here, but 1) they're very fast and 2) they speed up, but only a little. Ruby 2.3.4 is on the left, ruby head-of-master is on the right.

As with earlier transitions, everything slow speeds up. You can't see sub-median requests here, but 1) they're very fast and 2) they speed up, but only a little. Ruby 2.3.4 is on the left, ruby head-of-master is on the right.

As with earlier posts, this shows that Ruby head-of-master is incrementally speeding up nearly everything. Unlike some of the earlier Ruby versions, slower requests did not get disproportionate improvement here. Even the very fast requests (e.g. 5th percentile) sped up a tiny bit. One thing you can read into that: it's not primarily about the garbage collector speeding up, or about a few unusual slow operations. Most of Ruby has increased in speed by a small percentage, pretty uniformly.

Conclusions

With support for Ruby 2.4.0 and higher, this brings Rails Ruby Bench support to the present day. It also allows us to check for whether particular optimizations help Rails speed with a real application. Look for more of that in the future.

And as far as Ruby 2.4, if you're not using it, you're missing out on about 10%-15% extra speed in Rails. And if you're using Ruby before 2.3.4, you're missing even more speed!

If you hear somebody say "yeah, but these optimizations don't affect I/O-bound applications like most Rails apps," you now have a comprehensive answer: Ruby 2.0 to 2.4 has decreased request times for Rails by around 40% combined, and even more for slower requests. And by all indications, more speed is coming in the future.

Methodology and Footnotes

For the last post, I switched from using a t2.2xlarge EC2 instance to an m4.2xlarge instance. The latter is slightly slower but supports dedicated placement so that I don't have to worry about noisy neighbors (aka other VMs on the same hardware, affecting my benchmark speed.) I expect to stay with the m4.2xlarge for the foreseeable future. If you see modest differences in the specific number of requests per second or increases in the milliseconds per request, that's probably why. This shouldn't change the relative speed of different Ruby versions significantly, it's just a small multiplier on the graph scale.

Last post and this post both use dedicated EC2 instances instead of shared. Thus, the change to m4.2xlarge.

As always, my benchmark code is on GitHub, and the Ruby and Discourse code are standard and open-source. You can contact me for any of my benchmark JSON files. Data processing is done via process.rb in the benchmark repository. Graph output is now via Rickshaw. I don't put full source for graphs in the repository since it's repetitive and a little tedious - contact me if you want it. You can find an example Rickshaw output template in the graph directory of the repository. All Rickshaw output is based on variations of that template.

Besides GC, Has Ruby 2.3 Helped Rails Performance?

You may have read recently about how Rails performance has changed with recent Ruby versions. In that post, I concluded that newer Ruby is using a bit more memory, and has improved performance for the slowest requests by a lot. But that benchmark is pretty dependent on garbage collection (aka GC,) at least for the worst requests. You can read the original post for all the numbers of how things changed, and it's pretty clear that GC figures in significantly.

What if we measure Rails performance without garbage collection? What does it look like then?

(Just want more pretty graphs? Scroll down.)

How We Measure

Garbage collection and multiple threads interact a lot. It's really hard to tease performance apart when GC may be happening in the background. And it's hard to turn off GC when you're running lots of threads and they're generating lots of garbage. So for this post, we're measuring single-threaded straight-line performance. We're still measuring 1500 requests, just sequentially instead of in parallel.

Incidentally, don't directly compare request times or thread times between this post and the last one. I've started using an EC2 m4.2xlarge instance instead of a t2.2xlarge. Similar, but not the same. It allows me to use dedicated placement -- I'm not sharing my VM with other people's random VMs for the benchmark, which is a really, really good thing. However, the CPU is slightly slower. Also, this entire post uses single-process, single-threaded, single-load-tester performance numbers, which are completely different than the highly concurrent numbers in the previous post. This post measures things like "how long does it take one Puma worker to process 1500 requests while idling in between?" The previous post was measuring "how long does it take 30 load testers to each get 50 requests processed by 10 Puma processes using 60 Puma threads?" So: different results.

I put together a modified version of Puma, the app server used by my benchmark, that would allow me to manually trigger GC and report GC stats. And I wrote up a modified branch of the benchmark code to GC immediately before the 1500 requests. I had mostly debugged a solution to GC in between every request to not count GC time before I realized... with a major GC before 1500 consecutive requests on a single thread, on an EC2 m4.2xlarge, it never GCs anyway. At least, not after the first manually-triggered GC. So I verified that it didn't GC, but I didn't need to force it to GC in between requests, nor turn off GC manually.

Results

As with the previous benchmark, I ran the benchmark 11 times against Ruby versions 2.0.0, 2.1.10, 2.2.6 and 2.3.4. As with the previous version, there were no failed requests out of those 44 runs.

First we'll look at the performance, then we'll check side-by-side with the previous results. Remember that raw times are different, so you're looking at the curve of the graph. Also note the vertical scale of the second graph - it shows significant changes, but not nearly as huge as they look.

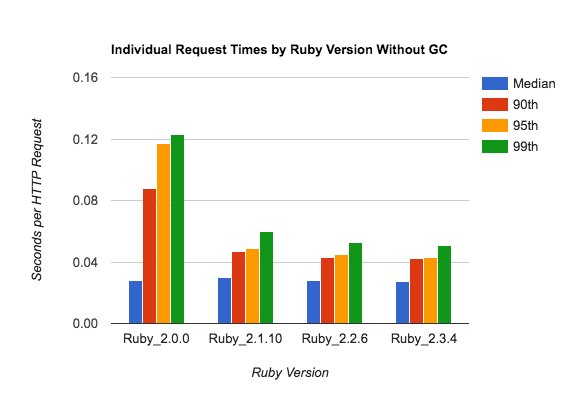
The first graph shows various percentile request times for individual requests, so the total is 16500 samples per Ruby version:

Without garbage collection, the 50th-percentile (blue) and 99th-percentile (green) request are within about a factor of two - not bad.

Without garbage collection, the 50th-percentile (blue) and 99th-percentile (green) request are within about a factor of two - not bad.

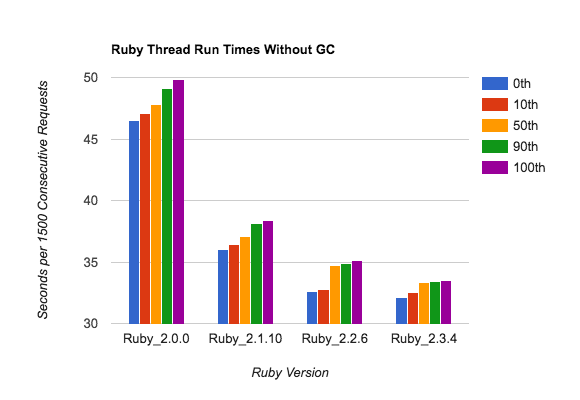
The second graph shows the aggregate runtimes for all 1500 consecutive requests, so you're seeing 11 samples per Ruby version (remember, single-threaded):

This is a very small sample size, but adding together 1500 requests/sample gives you some stability. There's not a lot of run-to-run variability. Note the vertical scale - these change by around 30%, not 5x.

This is a very small sample size, but adding together 1500 requests/sample gives you some stability. There's not a lot of run-to-run variability. Note the vertical scale - these change by around 30%, not 5x.

Let's see these side-by-side with the previous post's "with GC" results.

(Again, remember the bottom right graph starts at 30 on the vertical scale.)

The better and worse requests are much more similar in the GC-less (right-side) graphs. And GC doesn't affect just the 99th percentile - the 90th and 95th percentile are also farther from the median when GC is active. That makes sense, because GC runs in the background and can slow down many requests, not just requests where it first activates.

I also think just the medians (blue) tell an interesting story. Specifically: with no GC, the median request hasn't changed at all between Ruby 2.0 and 2.3, but slower requests improved by better than 50% (2x speed). Median-and-faster requests didn't change. All the non-GC Ruby 2.3 improvement for the median thread (not request) is coming from the slowest 30% of its 1500 requests. Email me if you'd like my JSON test data to run the same test. Or you can just reproduce the results for yourself.

So: every thread run has improved about 30% without GC, pretty much entirely from fixing its slowest requests. The median thread run with GC also improved about 30% (see left-hand graphs.) Every thread run has also improved about 30% with GC.

So: the garbage collector sped up by at least 30% between Ruby 2.0 and 2.3 (more, arguably) and sped up pretty evenly across requests. Non-GC speed optimizations were about the same, 30%, but concentrated far more on slow requests, with fast requests staying about the same.

Again, the numbers on the left and right are different setups. They're very apples-to-oranges. You're just looking for "oh, the median request improves over 30% with GC, and not at all without it."

Again, the numbers on the left and right are different setups. They're very apples-to-oranges. You're just looking for "oh, the median request improves over 30% with GC, and not at all without it."

Receipts

If you're curious about my methodology, you can see my code on GitHub. It uses a modified Discourse 1.5.0 (same version as in the previous blog post, for the same reasons explained there.) The only change from normal Discourse is that it uses that specific modified Puma by Git SHA from my GitHub fork of Puma.

I'm still working on getting my benchmark working with the Discourse 1.8.0 betas, which support Ruby 2.4.0.

What About Warmup?

When benchmarking your application, warmup iterations are a really good idea. Specifically: if you're running something a lot of times to figure out how fast it goes, start by running a bunch of "throwaway" iterations first.

Let's look at Rails Ruby Bench and see how warmup iterations change MRI's benchmark performance.

Just want graphs? Scroll down, you'll see them. Want the long-winded explanation of what warmup is and why we care? Keep reading.

But First, Why?

Warmup time makes sure all your code is compiled, and that Ruby has set up its method caches. It makes sure that code that will define methods on demand (like ActiveRecord) has already done so. If you're dealing with another caching system like databases, Rails fragment caching or your file system, warmup iterations make sure that those caches are full and ready.

Warmup time also lets Ruby's memory system scale up. MRI Ruby starts with a fairly small amount of memory and increases as it needs to, often during garbage collection. A bit like TCP/IP slow-start, Ruby's memory system intentionally starts out slow/small and consumes more resources as it sees more requests for memory. Depending on your app, you may also have a literal TCP/IP slow-start to wait through as well. The garbage collector will get faster over time in Ruby 2.3 for most programs because it's generational. When older permanent data is marked as "old generation," it won't be examined on most checks for garbage. That speeds up garbage collection as data that never goes away is rarely examined. (What data is "permanent"? Think of compiled classes or cache data structures. They may change, but they're not going to lose their references and be garbage collected. Until the program ends, they're not going away.)

The warmup gets your app into a "steady state", as the technically-minded folks would have it. Your app has allocated all appropriate resources, reclaimed early memory garbage, loaded up its caches and perhaps defined or monkeypatched methods where needed. All the early problems are worked out. The app should be running at full speed from the first post-warmup request.

Ruby implementations like Rubinius, OMR + Ruby, JRuby and TruffleRuby all need warmup iterations even more - they use JIT to compile frequently-used methods to a faster form. That always takes at least a few seconds. It can easily take several minutes to finish up. JIT is a lot of the reason JVM programs are infamous for long start-up time. It's why you generally use JVM languages for long-running servers, but rarely for command-line programs where a tenth of a second can be most of the runtime.

Timing

We looked at Ruby 2.3 with Discourse 1.5.0 recently. There's likely to be noticeable warmup in Ruby 2.3 since the new garbage collector is generational. A generational collector will get more efficient once its memory usage pattern is "burned in" and permanent data has been marked as being part of the old generation.

So let's look at varying amounts of warmup, between 0 and 1000 requests. As I began, I expected to see most of the difference between 0 and 10 requests of warmup, and maybe a bit up to 100 requests. With a JITting implementation like JRuby I'd expect to see a significant difference between 100 and 1000 warmup requests, but MRI doesn't do that.

Warmup behavior may also be a little funny because the warmup requests, like the later benchmark requests, get divided between receiving Puma workers and between requesting load-test threads. In other words, one warmup request doesn't mean one per Puma worker or one per load-test thread. It means exactly one, which may warm up only one of the Puma workers. Ten requests will hit most or all of the ten Puma cluster processes, and 100 requests will definitely hit all 10 Puma processes and all 30 load-test threads. Does it matter if every thread is warmed up? Not that I currently know of. The method cache should warm up extremely quickly, the first time each piece of code gets executed.

For all of these trials, I'm doing something along the lines of "for i in {1..11}; do ./start.rb -s 0 -w 0; done". The "-w" argument gives the number of warmup iterations. Every successful run-through give 1500 requests, so doing 11 of them gives around 15,000-16,500 requests for that combination of Ruby version and number of warmup iterations, depending on whether all 11 run-throughs succeed (for this post no runs failed, so it's 11 full runs for each.) As usual, I'm using process.rb in the Git repository for basic statistical processing.

Please look at the vertical axis labels - this difference is significant, but not nearly as big as it looks.

Please look at the vertical axis labels - this difference is significant, but not nearly as big as it looks.


Conclusions

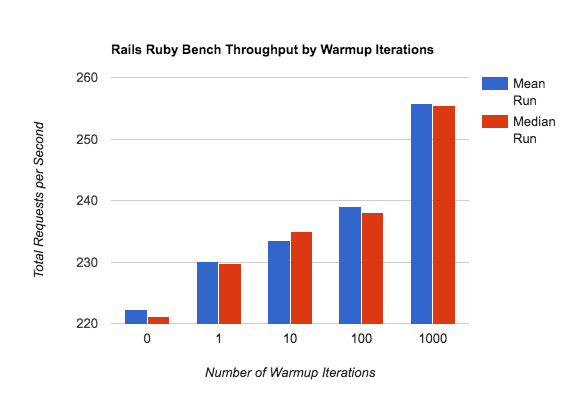
Looking at the request graph (the first one,) the big takeaway is: warmup is a noticeable thing, especially for slower requests like the 90th percentile - but it makes a small difference even for the median request. And even at 1000 warmup iterations, the effect continues. 100 warmup iterations is closer to 10 iterations' speed than to 1000. I wouldn't expect a big speedup at 100,000 warmup iterations, but it might still be continuing. And that's without JIT.

So: definitely include warmups in your benchmark.

Looking at the throughput graph (the second one,) we see about a 10% difference in throughput between no warmup and 1000 iterations of warmup (no really - check the vertical axis labels.) That's significant, but it's not crazy-huge. Warmup is a thing, even for MRI, but it still does a good job of keeping startup time low. Even starting completely flat-footed, it runs at about 90% of maximum throughput. That's not bad. We could make warmup look even more dramatic with fewer total requests, of course, but 1500 requests (about 6 seconds of total runtime with 10 Rails multithreaded processes) is short enough that warmup is already pretty dramatic.

Also, when looking at JIT-enabled implementations like JRuby, understand that some of the warmup isn't JIT. Other caches, the memory system, a generational garbage collector -- all of these things create a measurable speed difference between how your server runs after 100 requests and how it runs after 1000 or 10,000 requests.

What Didn't We Measure? What Needs Fixing?

By just restarting repeatedly, we didn't measure changes to the local file system cache -- files that got checked often were still in cache. Other OS changes that persist beyond the process boundary were probably not reset either. So: there's definitely more effect than we measured here. I can think of a few ways to check, but mostly by running large processes in between (reset the caches) or starting a new AMI every time (very slow.)

I'm sure there's a way in Linux to reset all sorts of fun process settings and re-warm things up. But at that point, we're mostly measuring Linux, not Ruby.

One problem I need to fix with benchmarking is that I'm not using a dedicated EC2 instance. Usually that's not a problem, but occasionally I bring up a t2.2xlarge that just isn't running acceptably -- and then kill it, of course. But realistically, it's time to start using dedicated instances. There's no such things as a dedicated t2.2xlarge - the closest is an m4.2xlarge, which is nearly the same but not quite. So: it'll be time soon to switch instance types.

View Models, Form Objects, Presenters, and Helpers Oh My!

This is the beginning of a series of blog posts on the different entities we at AppFolio use to manage logic in our server-rendered views. Now, much like the rest of the Rails community we too are moving towards more client-rendered views and a more client-server architecture but the majority of pages are still rendered server-side, and that will be the case for many years going forward. In such a setting it therefore still makes sense to discuss how we want to organize the code that renders these server-side views.

In this series we will be doing a deep dive into each of the concepts individually, but to start out I thought it would be good to give an overview of each concept and what we at AppFolio mean by them. There doesn't seem to be a consensus in the Rails community about what terms like “Presenter” mean and where the boundaries of responsibility lie.

I will by no means claim that what we’ve done will work for everyone - but it works well for us, and who knows - it may do the trick for you as well!


Key Concepts And Where To Find Them

View Models

At AppFolio a view model is the single object of interaction for the view. It is responsible for implementing the interface (data requirements) of a particular view template or partial.

I personally find a few things appealing about this. As someone who is still relatively new at AppFolio, a well-named method encapsulating complex logic to, say, decide whether or not a particular message is shown really helps me get up to speed quickly on the reason why a message should or should not be shown.

<% if !Company.has_enabled_this_feature? && (this_condition || that_condition) && one_more_condition %>
    <p>I’m an important message that will help drive adoption but only in certain contexts</p>
<% end %>

Is far less helpful than

<% if view_model.display_feature_marketing_messaging? %> 
    <p>I’m an important message that will help drive adoption but only in certain contexts</p>
<% end %>

Particularly given that when first working with said feature I’m more likely to know whether my changes should or should not be part of the marketing messaging than I am to know exactly which conditions we’re currently relying on for displaying the messaging. And if I do need that deep dive that logic is now isolated from the html noise in a PORO (Plain Old Ruby Object) for my casual perusal.

Not to mention the fact that if there need to be changes made to that logic I get to write nice little unit tests instead of controller tests. In addition to unit tests being faster than controller tests, unit tests also enable me to understand things more quickly, since the expected setup and output aren’t masked behind making get requests and parsing response bodies.

Form Objects

Form objects serve much the same purpose as view models but they specifically back an HTML form, and again in much the same way they implement the interface (data requirements) of a particular HTML form.

Why, then, would I not include them in the view models section? Well, form objects have some added responsibilities since they handle things like validations after the form has been submitted. Because of these extra responsibilities you will end up instantiating form objects in, for an instance, the update action of a controller, and as long as everything is valid that object will no longer be used to render the subsequent view (unless you want to render the same edit view even upon a successful form submission)

They further distinguish themselves from standard view models in that they “quack” like an ActiveRecord object in the sense that they have validations on the form fields (they include ActiveModel::Validations and other ActiveModel modules.) Furthermore, depending on the complexity of saving the actual form it may extend the default save behavior of the related objects.

Of the concepts discussed here form objects are the ones I’ve worked with least, but their value is already apparent from the few times I’ve worked with them. Because few forms represent only one ActiveRecord object, this separates business logic from, writing HTML, and encourages slim controllers.

Presenters

Presenter is by far the term that is most prevalent, and it can often include some of the responsibilities we’ve given to the view models, but for us a presenter wraps a particular ActiveRecord model or business concept. It provides methods that transform and format data for consumption by a view or another consumer (such as an API.) Since this blog post series is all about views we’ll just be talking about the view case.

I think at this point, a small example is in order. Imagine if you will that we have in our app the idea of a PhoneNumber - I know, radical right? But everywhere that we show a phone number we want it to be a TelLink to also have a button for sending a text message.

The exact styling of the number may change depending on context, so a full partial/view model pairing isn’t needed. Instead we’ll create a phone number presenter that takes in a phone number object and exposes a set of methods that return the various components that we want to have, namely an instance of a TelLink and an instance of the SendTextButton.

The great things about this is that we can instantiate this presenter in any view models that help render a view containing phone numbers, allowing the behavior to be consistent across views regardless of the context.

Helpers

A helper is a “functional” method (meaning it relies only on its inputs and not on any internal state stored in the classes it is included in) that provides easy access to commonly used logic. Rails of course provides many of these (such as link_to) but there are some basic formatting methods that also make sense as helpers, such as a method that takes in a value and provides a default value if the value is falsey.

def value_with_default(value)
 if value
   value
 else
   ‘--’
 end
end

What we’ve found is that many of the things we had put in helpers would actually make sense in a presenter, and since they were in helpers they ended up being included in other helpers that were then included in other helpers, leading to a big ‘ol ball of spaghetti that makes cleanup a lot more difficult.

In general, I’ve found that biasing towards trying to put something in a presenter first and then seeing if that feels off yields the best results, and it certainly leads to more OO design. After all, there are few things that are so ubiquitous that they aren’t tied to some well-defined business object or concept.


Looking Forward

Hopefully this overview has helped you get a basic idea of how we at AppFolio talk about and use view models, form objects, presenters, and helpers, as well as the value that adopting this sort of structure offers a development team. Over the next few months I’ll be releasing in-depth dives for each of those concepts focusing on real use cases and highlighting the value that view models can have to you, the developer.

In the meantime if you have any questions or feedback, feel free to reach out to me at mischa.lewis-norelle@appfolio.com or leave a comment!

Comparing Rails Performance by Ruby Version

The Ruby benchmark I've been working on has matured recently. It builds an AMI that runs the benchmark automatically and makes it downloadable from the AWS instance. It has a much better-considered number of threads and processes for Puma, its application server.

So let's see how it works as a benchmark. Let's see if there's been any particular change in Rails speed between Ruby versions. (Just want to see the pretty graphs? Scroll down.)

Because of Discourse, I'll only check Ruby versions between about 2.0.X and 2.3.X -- Discourse doesn't support 2.4 as of early April 2017. I'm not using current Discourse because the current version wants gems that don't support Ruby 2.0.X. That's a problem with using a real app for a benchmark: it creates a lot of constraints on compatibility! When I move to a version of Discourse that supports Ruby 2.4.0, it'll also be using syntax that prevents using Ruby 2.2.X or earlier. It's good that we're taking benchmarks now, I suppose, so that we can compare the speed to later Discourse versions! But that's another post...

Version Differences, Speed Differences

So we can only compare version 2.0, 2.1, 2.2 and 2.3? Great, let's compare them. I've added some extra logging to the benchmark to record the completion times of each individual HTTP request. That makes it easier to compare my benchmark with Discourse's standard benchmark, the one they run on RubyBench.

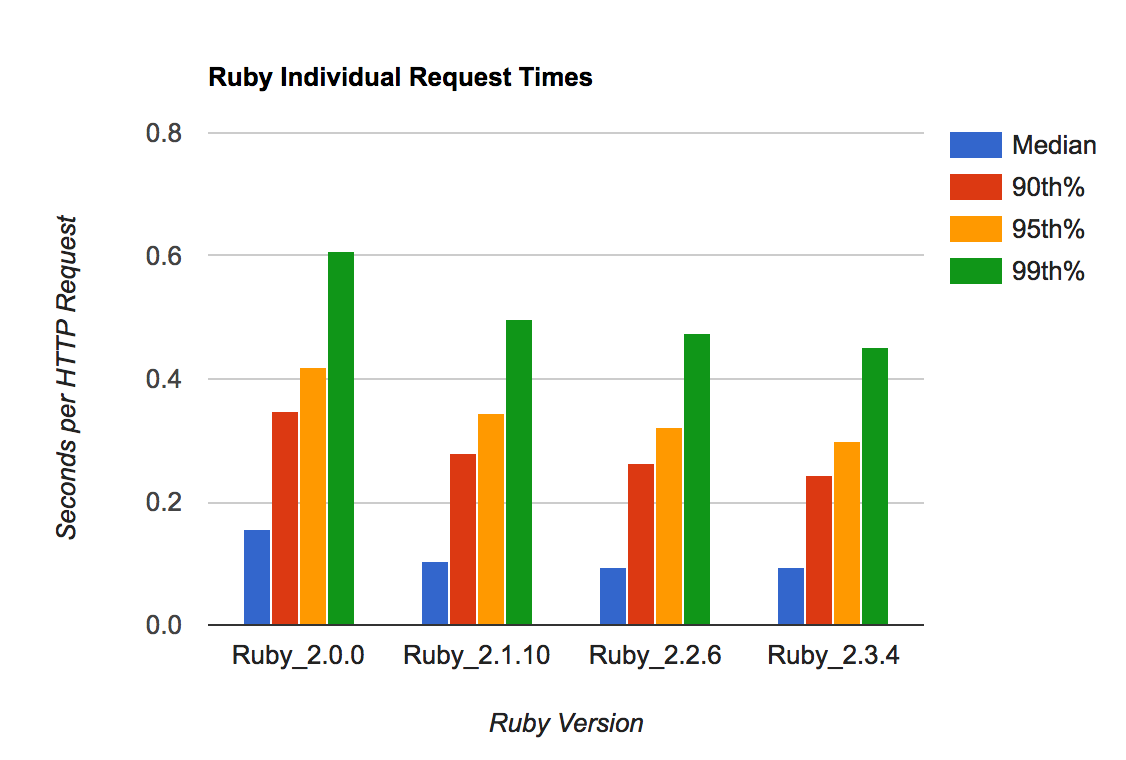
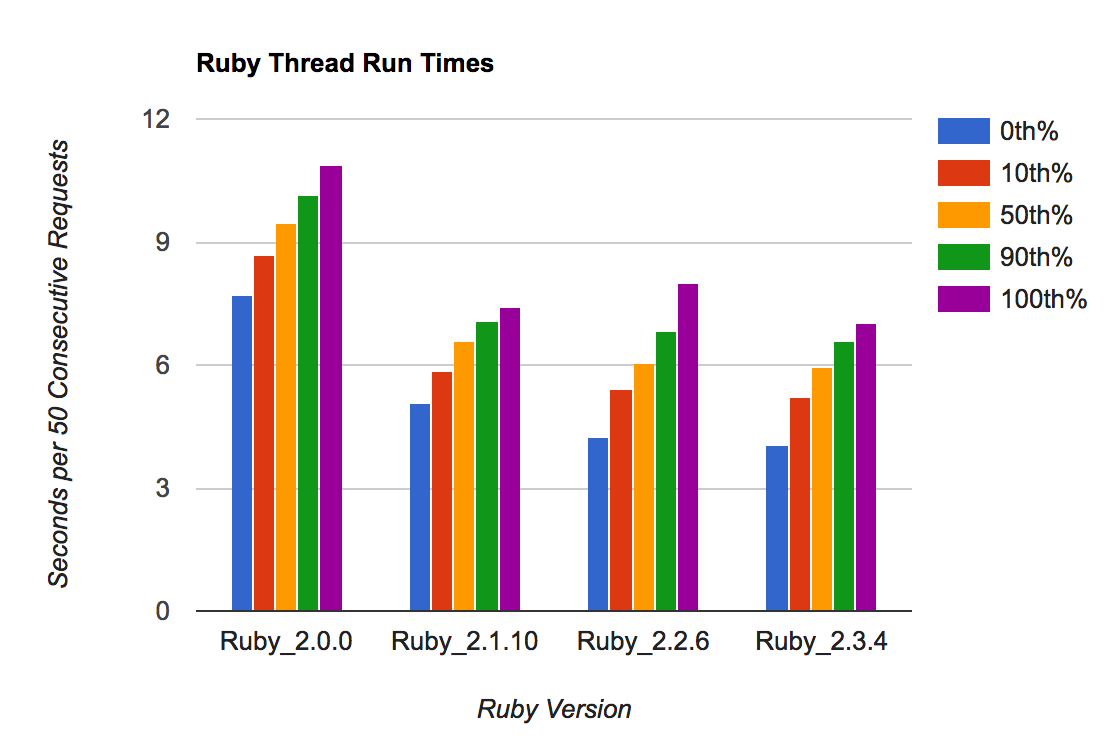
Each run of the benchmark completes 1500 requests, divided evenly among 30 load-testing threads. That's only 50 requests/thread, so you'll see some variation in how long the threads take to complete. I checked the variation between all individual requests (across all threads, 1500 samples/run) and the variation among single-thread runs (30 samples/run, 50 requests/sample.)

Individual request times - later Ruby versions are faster by a roughly constant factor.

Individual request times - later Ruby versions are faster by a roughly constant factor.

Each column here averages 50 individual requests. So there's less variation, but lots of slow, steady improvement.

Each column here averages 50 individual requests. So there's less variation, but lots of slow, steady improvement.

The individual request time varies a lot, as do the 0th and 100th percentiles -- that's expected. The median requests and per-run totals get noticeably faster - easily 30% faster by any reasonable estimate. And the slowest requests (90th+ percentiles) improve by a similar amount.

Here is the numeric processed data for these graphs. It's output from process.rb in the Git repo. I haven't included my JSON files of test data. But if you run tests using the public AMI (current latest: ami-36cb5820) or an AMI you create from the Packer scripts, you should get very similar results. Or email me and I'll happily send you a copy of my JSON results.

Ruby Bench

Ruby Bench has numbers for the original Discourse benchmark - but only for older Ruby and Discourse versions. But we can get a second opinion on how much Ruby performance has increased between 2.0 and 2.3. We'll check that the Rails Ruby Bench results are approximately sane by comparing them to a simpler, more established benchmark that's already in use.

Click the graph to rotate through pictures of several similar graphs from Ruby Bench. See the same Ruby Bench link to get source code and exact benchmark numbers.

There's a lot to those graphs. I'd summarize it as: the median request hasn't really gotten faster, but the 90th/95th/99th have gotten *much* faster, in some cases 2x or more. Yet another reason why "3 times faster" is hard to nail down.

Memory usage (the red graph) has also gotten a bit higher. So we've traded more memory for more even response times. That sounds like a win to me. YMMV.

Why hasn't the median request gotten faster in this benchmark? Hard to say. There may be a few optimizations that are included as backports that show up in the newer benchmark... But if so, not many. It's also possible that concurrent performance is better but straight-line sequential performance isn't. The default Discourse benchmark doesn't set "-c" for concurrency, so it's only checking one request at once.

(Edited to add: Nate Berkopec points out that a lot of this is probably garbage collection. Specifically: Discourse benchmarks hit one URL, and after Ruby 2.1 either have a *huge* 99th-percentile drop or barely any. My benchmarks hit a variety of URLs for every thread, and have a medium amount of 99th-percentile drop. So the post-2.1 drop is likely to be mostly GC. Discourse URLs that generate a lot of garbage dropped a lot in runtime, while URLs that generate very little garbage dropped barely at all. And all Rails Ruby Bench threads hit a mix of those. This is why I go to RailsConf.)

Ruby 3x3

So what does all this say about Ruby 3x3? It says that Ruby 2.3.4 is already running 150% the speed of 2.0.0-p648 for Ruby on Rails. That's a great start. It says that Ruby is fixing up a lot of edge cases - requests that used to cause slowdowns in rare cases are getting even rarer, so the performance is a lot more predictable.

I think it also suggests that my Rails benchmark is a pretty good start on measuring Rails performance in these cases.

Where we may really see some interesting effects for Rails is when Guilds are properly supported, allowing us to increase the number of threads and decrease processes, running more workers in the same amount of memory. This benchmark should really sing when Guilds are working well.

Caveats For Pedants Only - Everybody Else Close the Tab

Currently there are no warmup iterations after the server starts. That's going to significantly affect performance for non-MRI Ruby implementations, and probably has a non-trivial current effect even on MRI. I'll examine warmup iterations in a later post.

Data is written to JSON files after each run. You can see how that data is written in start.rb in the Git repo, and you can see how it's processed to create the Gist and data above in process.rb.

If even one request fails, my whole benchmark fails. So you're seeing only "perfect" runs where all 1500 requests complete without error. You'll see an occasional failed run in the wild. I see bad runs 5%-10% of the time. I don't currently believe this significantly skews the results, but I'm open to counterarguments.

In a later post I'll be increasing the total requests above 1500. Then the variance per run should go down, though the variance per HTTP request will stay about the same. 1500 requests just isn't enough for this EC2 instance size and I'll be correcting that later. Also, it's possible for "lucky" load threads to finish early and not pick up pending requests, so the 100th percentile load threads can have a lot of variation.

Ruby Bench uses Discourse 1.2.5, which is very old. I used 1.5.0 because it's the oldest version I could get working smoothly with recent Ruby and Ubuntu versions. I'll examine how Discourse has changed in speed in a future post. This is a hazard of testing with a real application that changes over time.

Ruby Bench uses very old versions of Ruby for its Discourse benchmark. Basically, Discourse broke for head-of-master Ruby when 2.4.0 merged Fixnum with Integer. So Ruby Bench stopped testing with newer versions. When Discourse works with Ruby 2.4 (note: coming very soon), they can update and I can write a speed-comparison blog post that includes 2.4.

Ruby Bench and my benchmark use different hardware (in my case, an EC2 t2.2xlarge non-dedicated instance.) The slope of the graph comparing one Ruby version with another should be similar, but the request times will be different. So: don't directly compare seconds/request between their graphs and mine, for many good reasons.

The standard Discourse benchmarks request the same URL many times in a row using ApacheBench. Ruby Bench uses the standard Discourse benchmark, so it does the same. My benchmark requests different URLs in different orders with different parameters, which affects the speed of the resulting benchmark. That's what I mean when I say their results should be only "roughly the same" as mine. You can think of my results as "roughly" a weighted blend of multiple of their results, plus some URLs they don't test.

I don't include 1st%/99th% data for full runs because there just aren't enough samples. Until you're looking at 500+ samples for each Ruby version, the 1% and 99% mark are going to bounce around so much that it doesn't make sense to show them. That's about 15 full runs-through of the benchmark for each Ruby version. That's perfectly doable, but more samples than I collected for this post. Instead, I showed the 90th and 10th percentile, which are much more stable for this amount of data. As stated above, you can also request my full JSON data files and get any percentile you feel like from the raw data.

(Have you read this far? Really? I'm impressed! By the way, AppFolio is hiring Ruby folks in Southern California and is an awesome place to work. Just sayin'.)

Rails Benchmarking: Puma and MultiProcess

This week, I've been playing with Puma processes. Headius, Nate Berkopec, you can probably stop reading now. You won't learn much ;-)

One consequence of the GIL is that a single Ruby process has limited ability to fully use the capabilities of a multi-core machine, including a larger AWS instance.

As a result, the optimum number of Rails processes for your AWS instance is probably not just one.

I'm still using my Discourse-based Rails benchmark, and we'll look at how the number of processes affects the total throughput. There are some slightly odd things about this benchmark that haven't changed since previous articles. For instance, the fact that Postgres and the load-testing process runs on the same machine as Puma. The load-testing process is singular now with only threads, which helps its impact noticeably.

A quick note on Puma: by default it will spawn threads on demand in a single Ruby process with a single GIL, up to a maximum of 16 or whatever you specify. In cluster mode it will spawn more Ruby processes, as many as you specify, each one having on-demand threads up to 16 or the number you picked.

Workers and Speed

In a previous post I played with load-testing threads to find out what it took to saturate Puma's default single process with a single GIL. In this post, I'll talk a bit more about what it takes to saturate an EC2 t2.2xlarge instance with Rails, database and load-testing processes.

With a single load-testing process and one Rails worker, you can get reasonable gains in total speed up to 5-7 load-testing threads. But there are two hyperthreaded cores on the instance, for a total of somewhere between 2 and 4 effective cores. We're already running five load-testing threads, one Rails thread, Postgres, and a normal collection of Ubuntu miscellaneous processes. Aren't we close to saturated already?

(Spoiler: not hardly.)

Per Aspera Ad Astra

Our time to process 1500 total requests with one Rails process was around 35 or 36 seconds. There's a bit of variation from run to run, as you'd expect. That involved adding more load-testing threads to generate more requests. Even a single process, with a GIL preventing simultaneous Ruby, still likes having at least 5 or so load-testing threads to keep it fully loaded.

How about with two processes? To process the same total number of requests, it takes 17 to 19 seconds, or around half the time. That's nice, and it implies that Rails is just scaling linearly at that point. It won't scale perfectly forever due to things like database access and a limited number of cores, but it's pleasant while it lasts. So clearly having two processes of 16 threads is a win for Rails throughput.

How about three processes? 13-14 seconds to process all 1500 requests, it turns out. And you can be sure that part of the delay there is in the load tester (remember, still only five load threads with a GIL), not the Rails server.

But what if we crank it up to 20 load threads? And 11 Puma processes, just to keep things interesting... And to process every request, it takes between 5.5 and 7.0 seconds, roughly. I wasn't expecting that when we started with a (tuned) one-Rails-process server at the beginning. Were you? Heck, at that level you have to wonder if the GIL is slowing things down *in the load tester*.

So go for broke: what about 30 load threads and 11 Puma processes?

Finally, at this point, we start seeing fun 500 errors, which you'd kind of expect as you just keep cranking things up. Postgres has a built-in limit of 100 connections (configurable upward), and 11 Puma processes with up-to-sixteen-on-demand threads for each one, plus the load testers, is finally exceeding that number. As a corollary, the previous 11 Puma threads with only 5 load threads were clearly not using all 16 threads per server -- if they did, we'd have hit this Postgres limit before, since 11 * 16 is more than 100.

Between you and me, I did have a breakage before that. I had to increase the number of ActiveRecord threads, called "pool", in database.yml before I hit Postgres' limit.

This all suggests an interesting possibility: what about limiting the number of threads per process with the higher number of processes? Then we can duck under the Postgres limit easily enough.

One More Time

Let's look at some (very) quick measurements on how fast it runs with different combinations of processes and threads...

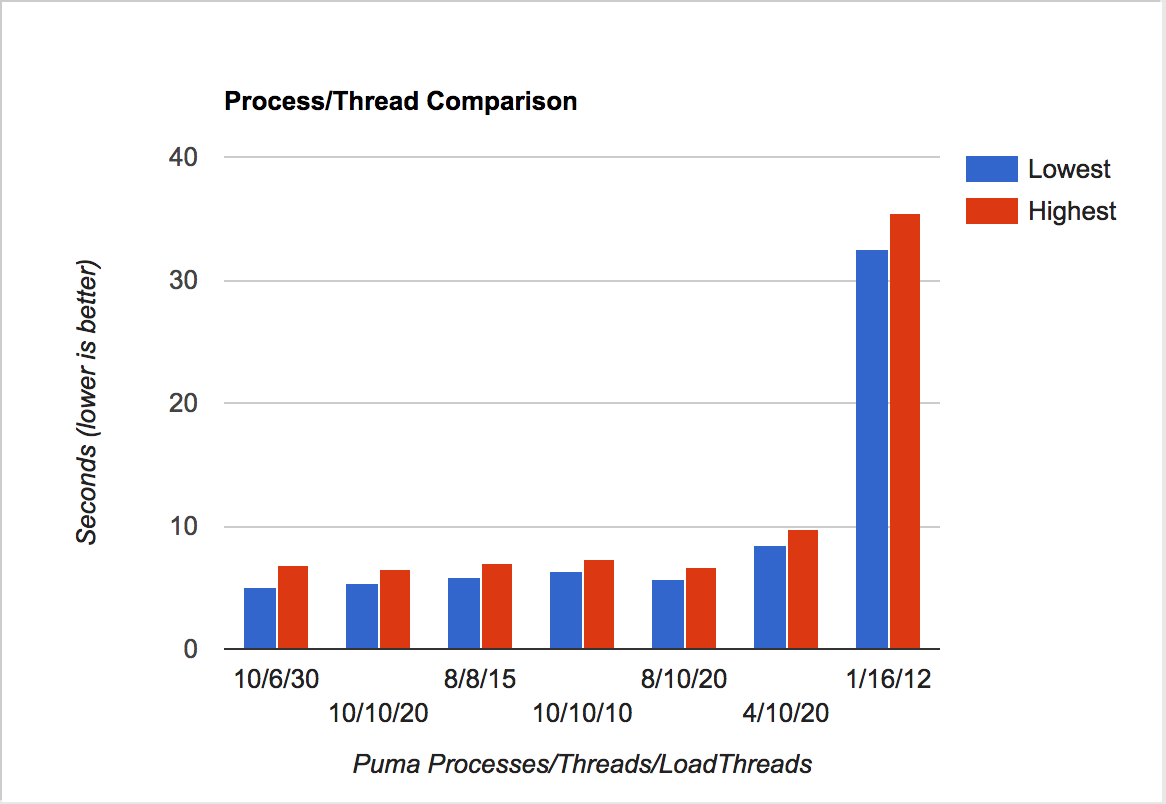
Performance by number of Puma threads and processes, and by load-testing threads.

Performance by number of Puma threads and processes, and by load-testing threads.

Puma Processes  Puma Threads  Load Threads  Time Taken  
10 6 30 5.1 - 6.8
10 10 20 5.3 - 6.5
8 8 15 5.8 - 7.0
10 10 10 6.3 - 7.3
8 10 20 5.7 - 6.7
4 10 20 8.5 - 9.7
1 16 12 32.6 - 35.5

(Note: all of this is done with current-latest Rails Ruby Bench and Ruby 2.3.1p112 - having some compatibility issues with latest 2.4.0 and latest Discourse release because of JSON 1.8.3 incompatibility. Working on it!)

To keep under the Postgres 100-connection limit, use threads for quick context switching and more processes for avoiding the GIL, there's a pretty good sweet spot at around 30 load-testing threads, 10 Puma processes and a limit of 6 threads/process. At that point, the noise in the benchmark starts to make it hard to tell whether a new configuration is faster -- there's too much noise and too little change. There's a tool to get around that, but for now, it's time to move to a different issue.

For now, let's call that success on tuning processes and threads. Later it's highly likely that the load-tester is hitting GIL contention with 30 (!) threads, and I'm *sure* this quick-and-dirty configuration check isn't the very fastest way to serve 1500 requests in Rails. But we've verified that anything starting at around 8-10 Puma processes, 5 processes/thread and 20+ load testing threads will get us into quite decent performance (5-8 seconds for 1500 requests.)

But this is definitely the low-hanging fruit, and a solid configuration. And we don't need or *want* it to be perfect. We want it to be a representative configuration for a "normal" "real" Rails app, laboring hard. Speaking of which...

Ruby 3x3

Even this little two-to-four-core EC2 instance is clearly benefiting a lot from having lots of Ruby threads running at once. That's a really good sign for Ruby Guilds. It's also great for JRuby, which has the JVM's world-class thread performance and no GIL. Expect me to time JRuby in a future post, after adding some warmup iterations to keep JRuby's JIT from making it look incredibly slow here. 1500 requests just isn't that much, and even for MRI the total number may need an increase.

Later, it's likely I'll reimplement the load tester to use clustered processes with many worker threads. I think the load tester is a *great* place to use guilds once they become available, and to measure their performance when it's time to. But there may be some interesting difference between multithreaded speed and Guild speed, depending on what objects are accessed...

Hope you've enjoyed reading about this Rails benchmark performance! I'll keep writing as it evolves...

Ruby, RubyGems and Bundler

Ruby, RubyGems and Bundler can be a bit of an intertwined mess -- it can be hard to tell what magic incantation will tell you what went wrong and how to fix it.

The secret is that they're three separate layers. Ruby was originally designed without RubyGems. RubyGems is a separate layer on top with a few seams where it was designed to be detached. Bundler was created for Rails 3.0, and was built on top of a perfectly good RubyGems to add more functionality.

In other words, it makes sense to learn them separately even if you'll only use them together. Otherwise, how can you tell what's wrong with what library?

We won't discuss version managers like rvm, rbenv or chruby here. Rest assured that they're another whole layer with their own power and subtleties. They do interact with gems, not only the Ruby executable.

I found this talk by Andre Arko after writing this - he mentions a whole setup.rb step in between Require and RubyGems that you can ignore completely. It has a lot of great additional detail and history.

Ruby

Ruby, at its lowest level, doesn't really have "libraries" built in. It has the ability to "load" or "require" a file, and it has $LOAD_PATH, an array of paths to check when you ask for a filename.

"Load" just does what it says: read the file and execute the Ruby inside. It's almost the same as if you'd just written "eval File.read('filename')", except that it checks the paths in the $LOAD_PATH, in order, to figure out where to find your filename. Well, and it also executes inside a top-level Ruby object called "main" rather than exactly where you called "eval". Still, it's a pretty straightforward command.

"Require" is just slightly more complicated. It keeps a hash of what files have already been required. If you ask for a new one, it will load it. If you ask for a file you've already required, it will do nothing. "Require" also tries hard to not re-require different paths if they point to the same file -- think of symbolic links between directories, for instance, or relative pathnames versus absolute. Require tries to chase down the "real" canonical location of the file so it can avoid requiring the same file twice except in pretty extreme circumstances.

Ruby starts with a few default entries in the $LOAD_PATH. You may want to pop into irb and type "$LOAD_PATH" to see what they are for you. An old version of Ruby like 1.8.6 had even fewer since RubyGems wasn't loaded until you manually required it. In recent versions, you can see that RubyGems is installed by default - you're likely to see some gems automatically in the $LOAD_PATH.

You'll also notice that the current directory (".") isn't in the $LOAD_PATH. Long ago it used to be. These days it isn't. That's why you can't just "require 'myfile'" and have it magically find myfile.rb from the current directory. I mean, unless you stick "." into the $LOAD_PATH array, but that's not a common thing to do.

RubyGems

RubyGems is a library on top of Ruby. You can upgrade it separately from your Ruby language version. RubyGems also has some command-line commands and strong opinions that old versions of Ruby didn't originally have.

The "gem" command will show you a lot about how RubyGems is currently set up. Specifically, try typing "gem env" and see all the good stuff:

RubyGems Environment:
- RUBYGEMS VERSION: 2.5.1
- RUBY VERSION: 2.3.1 (2016-04-26 patchlevel 112) [x86_64-darwin15]
- INSTALLATION DIRECTORY: /Users/noah.gibbs/.rvm/gems/ruby-2.3.1
- USER INSTALLATION DIRECTORY: /Users/noah.gibbs/.gem/ruby/2.3.0
- RUBY EXECUTABLE: /Users/noah.gibbs/.rvm/rubies/ruby-2.3.1/bin/ruby
- EXECUTABLE DIRECTORY: /Users/noah.gibbs/.rvm/gems/ruby-2.3.1/bin
- SPEC CACHE DIRECTORY: /Users/noah.gibbs/.gem/specs
- SYSTEM CONFIGURATION DIRECTORY: /Users/noah.gibbs/.rvm/rubies/ruby-2.3.1/etc
- RUBYGEMS PLATFORMS:
- ruby
- x86_64-darwin-15
- GEM PATHS:
 - /Users/noah.gibbs/.rvm/gems/ruby-2.3.1
 - /Users/noah.gibbs/.rvm/gems/ruby-2.3.1@global
- GEM CONFIGURATION:
 - :update_sources => true
 - :verbose => true
 - :backtrace => false
 - :bulk_threshold => 1000
- REMOTE SOURCES:
 - https://rubygems.org/
- SHELL PATH:
 - /Users/noah.gibbs/.rvm/gems/ruby-2.3.1/bin
 - /Users/noah.gibbs/.rvm/gems/ruby-2.3.1@global/bin
 - /Users/noah.gibbs/.rvm/rubies/ruby-2.3.1/bin
 - /usr/local/bin
 - /usr/bin
 - /bin
 - /usr/sbin
 - /sbin
 - /Users/noah.gibbs/.rvm/bin

There are a bunch of environment variables that affect where and how Ruby finds gems. "Gem env" shows you where they're all currently pointed. Useful!

That list of "GEM PATHS" tell you what RubyGems puts into the $LOAD_PATH to let Ruby find your gems. The "INSTALLATION DIRECTORY" is where "gem install" will put stuff.

RubyGems does some interesting things, but it's mostly an extension of $LOAD_PATH. It doesn't do as much fancy stuff as you might think. As a result, it doesn't have any ability to find things that aren't locally installed - you can't use a gem from Git using RubyGems for instance, because how and when would you update it? RubyGems has a path it installs to, a few paths it looks through, and the ability to turn a directory of files into an archive (a "gem file", but not at all like "Gemfile") and back.

The last one is interesting. You can "gem build" a gemfile, if you have a .gemspec file in the right format. It's just a YAML manifest of metadata and an archive of files, all compressed into a single ".gem" archive. But you can push it to remote storage, such as RubyGems.org or a local gem server (see GemInABox for an example.)

That's also how "gem install" works - it downloads a .gem archive, then unpacks it to a local directory under the "INSTALLATION DIRECTORY". The reason for things like "spec cache" above is that to download .gem archives, RubyGems wants to know who has what versions of what gems, and what platforms and Ruby versions they're compatible with. The spec files have that information but not the whole archive of files. That's so that they're smaller and quicker to download.

One more subtlety: gems are allowed to build native extensions. That is, they can link to system libraries and build new files when you install them. So this is a *bit* more complicated than just unpacking an archive of Ruby files into place. It can also involve fairly convoluted install steps. But they're basically a run-on-install shell script to build files. This is also why every Ruby version you have installed saves its own copy of every gem. If a gem builds an extension, that's compiled against your local Ruby libraries, which are different for every version of Ruby. So that copy of Nokogiri actually has different files in the Ruby 2.3.1 copy than in the Ruby 2.4.0 copy or the Ruby 1.9.3 copy. That's what happens when you build them each with different libraries, it turns out.

RubyGems is more complicated than plain old "load" and "require." But nothing I've described is terribly magical, you know?

Bundler

Bundler is a much more powerful, complex and subtle tool than RubyGems. It has more weird behaviors that you have to understand, and it enables a lot more magic.

It solves a lot of long-standing RubyGems problems, and replaces them with a new crop of Bundler-specific problems. No tool can just "do what you want" without you having to describe what you want. Bundler is no exception.

You can tell you're using Bundler when you're messing with the Gemfile and Gemfile.lock, or when you use the "bundle" command. You can also start Bundler from your Ruby files. That's why Rails commands run with Bundler active, but don't start with the "bundle" command.

The first thing Bundler does is to make undeclared gems "invisible." If it's not in your Gemfile, you can't require it. That's really powerful because it means somebody else can tell what gems you were actually *using*. It also makes undeclared gem *versions* invisible. So if you have five versions of JSON installed (don't laugh, it happens), this will make sure you get the right one and only the right one. This trick requires "bundle exec" (see below.)

It also has "bundle install". If you have a list of all the gems you can use, it makes sense to just let you install them. That's probably the most wonderful magic in Bundler. If you remember the old system of gem declarations in Rails' environment.rb, you understand just how incredible Bundler is. If you don't remember it... That's probably for the best.

Similarly, it has a Gemfile.lock with the specific version of all your gems. So even if you give a range of legal versions of MultiJSON, the Gemfile.lock will list the specific one you're currently using. That way, everybody else will also get the same version when they "bundle install" using your Gemfile.lock. For complex but good reasons, you should check in an application's Gemfile.lock so that everybody gets the same versions you do, but you should *not* check in a library's Gemfile.lock because you *can't* make everybody use your same dependencies. Oy.

Bundler also figures out which Gem versions are compatible with which other versions. When Bundler creates Gemfile.lock, it makes sure that the whole set of different gem versions works together, and that they get activated in the right order with all the right versions. Getting all your gem versions loaded in the right order used to be a very ugly process. Bundler fixes it.

Bundler can also use somewhat-dynamic gems. Specifically, you can declare a "git" URL in your Gemfile and Bundler will check it out locally and make sure it gets into your $LOAD_PATH so that "require" works. The Gemfile can also take gems with a ":path" option to point to un-installed local gems, such as in a checked-out repo. Both of these things require Bundler to be active inside your Ruby process -- just setting $LOAD_PATH isn't enough, the Bundler library has to be active. Be sure to run with "bundle exec" or this won't work.

Bundler still does a lot of this with $LOAD_PATH magic. The rest is done by loading its library into your Ruby process, changing how "require" works. It gets loaded via "Bundler.setup" in Ruby, or something like Rails or "bundle exec" that calls it. There may also be a sacrifice of goats involved, so check your version number carefully.

Because Bundler needs to be running inside your Ruby process, you'll need to activate it. The easiest way to do this manually is to type "bundle exec" in front of your process name. That will find the right Gemfile, set an environment variable so that sub-processes running Bundler will use the same one, and generally make sure everything gets properly loaded. Just be careful - if you run a sub-process that also runs Ruby, it can be hard to make sure it's using the same Bundler in the same way. When in doubt, run "bundle exec" in front of the command line if there's any chance that it could run something in Ruby.

Bundler also has a facility for "vendoring" gems -- that is, copying specific versions to a local directory and using them there, not from system directories. That can be valuable, but the way Bundler does it is kind of magical and kind of brain-bending. It's better than the old RubyGems method of copying the files to a local directory and replacing $LOAD_PATH. But it's still pretty weird.

If you're having trouble figuring out what's going on in Bundler, the answer is usually "bundle exec". For instance, "bundle exec gem env" will show you where Gems get installed or loaded with Bundler active, which can be a huge revelation. "Oh, *that's* why I'm not seeing it." Similarly, running things like "bundle exec gem list --local" shows you what Bundler can and can't see. That's very powerful.

There are rumors that Bundler will wind up built into RubyGems. If that happens, it will eliminate some of the headaches with subprocesses and manually running "bundle exec". That would be awesome. In the mean time you're going to need to know more about this than you'd like. I feel your pain, I promise.

Rails Benchmarking and a Public AMI

You remember that Rails benchmark I've been working on? I've been making it friendlier to quick runs and getting results in its final (?) AWS configuration.

If you check its Git repository, you'll find lots of Packer code to make a nice AMI that boots up and puts JSON benchmark results into a publicly-served directory. At least, if you happen to know the right IP address to go to. I'm assuming your JSON results aren't terribly important to your security -- or that you can modify the Packer code yourself, or not expose a public IP address when you spin up the AWS instance. Suit yourself.

I've just made the AMI public: ami-745b8262. That means you should be able to spin up a new instance of it with something like the following:

aws ec2 run-instances --image-id ami-745b8262 --count 1 --instance-type t2.2xlarge --key-name my-ec2-keypair-name

Replace the keypair name with your own keypair, naturally. Though you don't have to SSH in. Instead, you can navigate to the instance's public IP address, and to /benchmark-results/ to see a directory of (currently one file of) benchmark results. See /etc/rc.local if you're curious how the benchmark is run. The code is all from the repository above, naturally.

I'm still modifying the benchmark and the tooling. But I'd love any feedback you have. Is this a convenient way to make a benchmark canonically accessible? I'm also still testing AWS performance to see how the above varies from using dedicated hardware -- the above command line still uses standard shared instances if you copy and paste it verbatim.


The Benchmark and the Rails

Not long ago, I wrote about benchmarking Rails for the Ruby team and how I thought it should probably be done. I got a little feedback and adjusted for it. Now I've implemented the first draft of it. That's what you do, right?

You can read those same benchmarking principles in the README for the benchmark if you're so inclined, and how to build an AMI to test the same way. You can also benchmark locally on Mac OS or Linux -- those just aren't the canonical numbers for the benchmark. Something has to be, and AWS seems like the way to go, for reasons discussed in the previous blog post, the README, etc.

So let's talk a bit about how the code came out, and what you can do with it if you're so inclined.

Right now, you'll need to run the benchmark locally, or build your own AMI. You can run that AMI on a t2.2xlarge instance if you want basically-official benchmark results.

I'd love quibbles, pull requests, bug reports... Anything along those lines.

And if you think it's not a fair benchmark in some way, great! Please let me know what you think is wrong. Bonus points if you have a suggestion for how to fix it. For instance: on my Mac, using Puma cut nearly twenty-five percent of the total runtime relative to running with Thin. Whoah! So running with Thin would be a fine example of bad benchmarking in this specific case.

I don't yet have a public AMI so that you can just spin up an instance and run your own benchmarks... yet. It's coming. Expect another blog post when it does.

Threads, Threads, Threads

Nate Berkopec pointed out that a lot of the concurrency and threading particulars would matter. Good! Improving concurrency is a major Ruby 3x3 goal. Here are some early results along those lines...

The "official" AWS instance size, like my laptop, has four "real" cores, visible as eight Intel hyperthreaded cores. Which means, arguably, that having four unrelated processes going at all times would be the sweet spot where the (virtualized) processor is fully used but not overused.

I originally wrote the load-testing program as multiple processes, and later converted it to threads. The results turned out to be in line with the results here: a block of user actions that previously took 39 or 40 seconds to process suddenly took 35 to 37 seconds (apples-to-oranges warning: this also stopped counting a bit of process startup time.) So: definitely an improvement when not context-switching between processes as often. Threaded beats multiprocess for the load tester, presumably by reducing the number of processes and context switches.

Rails running in Puma means it's using threads not processes as well. One assumes that Ruby 3 guilds, when Rails supports them, will do even better by reducing Global Interpreter Lock (GIL) contention in the Rails server. When that happens, it'll probably be time to use guilds for the load-tester as well to allow it to simultaneously execute multiple threads, just as the Rails server will be.

So: this should be a great example of improving benchmark results as guilds improve multithreaded concurrency.

Interestingly, the load tester keeps getting faster by adding threads up to at least five worker threads, though four and five are very close (roughly 29.5 vs 30.8 seconds, where per-run variation is on the order of 0.5-0.8 seconds.) That implies that only four simultaneous threads in the load-tester doesn't quite saturate the Rails server on a four-core machine. Perhaps there's enough I/O wait while dealing with SQLite or the (localhost) network somehow, or while communicating with Redis? But I'm still guessing about the reasons - more investigation will be a good idea.

Benchmarking on AWS

One of the interesting issues is clearly going to be benchmarking on AWS. Here are a few early thoughts on that. More will come as I take more measurements, I promise :-)

AWS has a few well-known issues, and likely more that aren't as well-known.

One issue: noisy neighbors. This comes in several flavors, including difficulties in network speed/connection, CPU usage and I/O. Basically, an Amazon instance can share a specific piece of physical hardware with multiple other virtual machines, and usually does. If you wind up on a machine where the other virtual hosts are using a lot of resources, you'll find your own performance is lower. This isn't anything nefarious or about Amazon overselling - it's standard VM stuff, and it just needs to be dealt with.

Another issue: central services. Amazon's infrastructure, including virtual machine routing, load-balancing and DNS are all shared with a gigantic number of virtual machines. This, too, produces some performance "noise" as these unpredictable shared services behave slightly differently moment-to-moment.

My initial solution to both these problems is to make as little use of AWS networking as possible. That doesn't address the CPU and I/O flavors of noisy neighbors, but I'm getting nicely consistent results to begin with... And I'll need to filter results over time to account for differing CPU and I/O usage, though I'm not there yet.

Another thing that helps: large instances. The larger the size of the AWS instance being used, the fewer total VMs you'll have on the physical hardware you're sharing. This should make intuitive sense.

Another commonly-used solution: spin up a number of instances, do a speed test, and then keep only the N fastest instances for your benchmark. This obviously isn't a theoretical guarantee of everything working, since a quiet "neighbor" VM may become noisy at any time. But in general, there's a strong correlation between a random VM's resource usage at time T and at time T + 3. So: selecting your VM for quiet neighbors isn't a guarantee, but it can definitely help. Right now I'm doing the manual flavor of this where I check by hand, but it may become automated at some point in the future.

Onward

From here, I plan to keep improving the benchmark quality and convenience in various ways, and assess how to get relatively reliable benchmarks out of AWS.

What I'd love is your feedback: have I missed anything major you care about in a Rails benchmark? Does anything in my approach seem basically wrong-headed?

Big thanks to Matt GaudetChris SeatonNate Berkopec and Charles Nutter, who have each given significant feedback that have required changes on my part. Thanks for keeping me honest, gentlemen!


You -- Yes, You -- Can Speak at a Conference

I've been having this talk with the coworkers a lot lately. So let's talk about it here, shall we?

You, O budding programmer (or non-programmer) can speak at a conference. Better yet, you can speak in a useful way and somebody will enjoy it. Let's talk about why.

You've done a couple of weeks of work on something at some point, right? Maybe it was regular expressions. Or Ruby on Rails controllers. Or learned a little about Rust or Haskell. Or how to solve a Rubik's cube. You're literate (because you're reading this post) which means you learned how to do something at some point.

When you were doing that work, you know who would have been perfect to help you out? Future-you, a few weeks or months further along in the same task.

Six months on, you've forgotten a bunch of what problems you had. If you became amazing at the same task, you forgot everything you used to have trouble with (it turns out that it's called "the curse of knowledge" and it's totally a thing.)

Which means that whatever you've spent a few weeks on (or a few months, or a few years,) you are perfect to help out the person who is a few weeks behind you.

If you're only a few weeks in, you can submit that as a talk to perfect beginners -- and you're the best person in the world to help them out.

Or if you've been doing something for a few years (Ruby programming, databases, competitive eating), you're the perfect person to help other people out who are farther along.

If you've put the time into something, that's a pretty good indicator that somebody finds it interesting. You did.

If you can't find a talk about stuff you're doing -- great, you should give one!

So stop every week or three at work or play. Scribble down what you're working on. And now next time you want to submit and idea for a talk, use one of those.

And you'll know you're the perfect person to give that talk. And you a few weeks (or months) earlier is who you should say the talk is for.

Got it?


RVM Errors with Latest Ruby?

Are you trying to build Ruby 2.4.0 or later, including the 2.4.0 preview releases? Are you doing it by installing with RVM? Are you seeing errors like the ones below?

Ruby (specifically Rubygems) now pulls code from repos with submodules. That requires an RVM change.

To fix it, some day you can upgrade to the latest RVM using "rvm get head". In the mean time, you can use older Rubygems. Don't "rvm install ruby-head". Instead, "rvm install rubyhead --rubygems 2.6.6". Curious if it's been long enough and you can use the latest Rubygems? See the rvm issue for it.

Once that issue is fixed, the correct fix should be "rvm get stable" instead of specifying a specific older RubyGems version for each Ruby installation.

Screenshot of the problem here - see below for cut-and-pasteable output.

Screenshot of the problem here - see below for cut-and-pasteable output.


rails_ruby_bench noah.gibbs$ rvm install ruby-head-nobu --url https://github.com/nobu/ruby.git --branch round-to-even
Checking requirements for osx.
Installing requirements for osx.
Updating system..............
Installing required packages: coreutils...
Certificates in '/usr/local/etc/openssl/cert.pem' are already up to date.
Requirements installation successful.
Installing Ruby from source to: /Users/noah.gibbs/.rvm/rubies/ruby-head-nobu, this may take a while depending on your cpu(s)...
HEAD is now at 61a7af5 add to: :nearest option
From https://github.com/nobu/ruby
 * branchround-to-even -> FETCH_HEAD
Current branch round-to-even is up to date.
git checkout round-to-even
Copying from repo to src path...
ruby-head-nobu - #autoreconf.
ruby-head-nobu - #configuring..................................................................
ruby-head-nobu - #post-configuration.
ruby-head-nobu - #compiling....................................................................................................
ruby-head-nobu - #installing.......
ruby-head-nobu - #making binaries executable..
ruby-head-nobu - #downloading rubygems-7d3b7063184c0de861d9f31285ee1e7357efde15
ruby-head-nobu - #extracting rubygems-7d3b7063184c0de861d9f31285ee1e7357efde15.....
ruby-head-nobu - #removing old rubygems.........
ruby-head-nobu - #installing rubygems-7d3b7063184c0de861d9f31285ee1e7357efde15.
Error running 'env GEM_HOME=/Users/noah.gibbs/.rvm/gems/ruby-head-nobu@global GEM_PATH= /Users/noah.gibbs/.rvm/rubies/ruby-head-nobu/bin/ruby -d /Users/noah.gibbs/.rvm/src/rubygems-7d3b7063184c0de861d9f31285ee1e7357efde15/setup.rb --no-document',
showing last 15 lines of /Users/noah.gibbs/.rvm/log/1479161946_ruby-head-nobu/rubygems.install.log
[2016-11-14 14:22:20] /Users/noah.gibbs/.rvm/rubies/ruby-head-nobu/bin/ruby
current path: /Users/noah.gibbs/.rvm/src/rubygems-7d3b7063184c0de861d9f31285ee1e7357efde15
GEM_HOME=/Users/noah.gibbs/.rvm/gems/ruby-2.3.1
PATH=/Users/noah.gibbs/.rvm/usr/bin:/usr/local/opt/coreutils/bin:/usr/local/opt/pkg-config/bin:/usr/local/opt/libtool/bin:/usr/local/opt/automake/bin:/usr/local/opt/autoconf/bin:/Users/noah.gibbs/.rvm/gems/ruby-2.3.1/bin:/Users/noah.gibbs/.rvm/gems/ruby-2.3.1@global/bin:/Users/noah.gibbs/.rvm/rubies/ruby-2.3.1/bin:/usr/local/bin:/usr/bin:/bin:/usr/sbin:/sbin:/Users/noah.gibbs/.rvm/bin:/Users/noah.gibbs/.rvm/bin
GEM_PATH=/Users/noah.gibbs/.rvm/gems/ruby-2.3.1:/Users/noah.gibbs/.rvm/gems/ruby-2.3.1@global
command(7): env GEM_HOME=/Users/noah.gibbs/.rvm/gems/ruby-head-nobu@global GEM_PATH= /Users/noah.gibbs/.rvm/rubies/ruby-head-nobu/bin/ruby -d /Users/noah.gibbs/.rvm/src/rubygems-7d3b7063184c0de861d9f31285ee1e7357efde15/setup.rb --no-document
Exception `LoadError' at /Users/noah.gibbs/.rvm/rubies/ruby-head-nobu/lib/ruby/2.4.0/rubygems.rb:1345 - cannot load such file -- rubygems/defaults/operating_system
Exception `LoadError' at /Users/noah.gibbs/.rvm/rubies/ruby-head-nobu/lib/ruby/2.4.0/rubygems.rb:1354 - cannot load such file -- rubygems/defaults/ruby
Exception `Gem::MissingSpecError' at /Users/noah.gibbs/.rvm/rubies/ruby-head-nobu/lib/ruby/2.4.0/rubygems/dependency.rb:308 - Gem::MissingSpecError
ERROR:While executing gem ... (Errno::ENOENT)
No such file or directory @ dir_chdir - bundler/lib

Using RVM with Locally-Built Ruby

If you use RVM, I'm sure you're used to installing your Rubies with it. It's a great way to make sure your build dependencies are up-to-date, to build a Ruby that doesn't overlap with your other stuff, to manage paths and gems...

(And yes, it has some down sides. By and large I still like it quite a bit. But if you use rbenv instead, I have no stones to throw. Rbenv and ruby-build are a great combination too, and will get you where you need to be.)

It's less obvious that you can use RVM to build and install Ruby from a local clone of the Ruby GitHub repo or another similar one -- for instance, if you're messing with Ruby patches yourself, or you're cloning from somebody who is.

Name and Location

Two little-known RVM features help us out here: Named Rubies, and the (undocumented, I think) --url option to "rvm install."

Which means you can do something like this:

rvm install ruby-head-nobu --url https://github.com/nobu/ruby.git --branch round-to-even

Now you have a normal-looking RVM-installed Ruby, in this case called "ruby-head-nobu", from pure-custom source. You can even build it from a local repo (see below.) Do you see errors instead? Try "rvm get head" to upgrade to the latest RVM - they patched a problem with this on November 9th, 2016.

A quick disclaimer: don't use a name like "ruby-head-round-even". Turns out that you can't have any more dashes in the name. It just cuts them off and you get a name like "ruby-head-even". Which is pretty confusing at the time. Don't use dashes in the last part of the name.

Another disclaimer: RVM has only recently updated to support Ruby including Bundler. So you may need to update RVM to latest stable before "rvm install ruby-head" works at all, custom URL or no.

Do It Locally

If you just pass the path to a local repo above as a URL, it doesn't work. It tries to clone your local directory with SVN, which doesn't work. Same problem with a file URL. How do you get it to use Git, which is smart about these things?

I had to read through the RVM source to find this out, but if your URL contains the string "git" anywhere, RVM assumes it should use Git, not SVN, to clone it.

So this worked for me:

rvm install ruby-head-nobu --url file:///Users/noah.gibbs/src/ruby/nobu_ruby/.git --branch round-to-even

It's a bit of a hack -- it only works because the URL happens to contain "git" and that's what RVM checks for as of this writing. And because you're allowed to clone from the .git directory. But it works for me! This saves a very time-consuming "git clone" step over the network. The Ruby repo is pretty big at this point, and Git is smart about how it clones a repo from the local file system.

Made of Win

This is all useful if you're building Ruby locally -- it can be annoying to set up individual install directories and then mess with your PATH and RUBYLIB. And an installed Ruby can be necessary to do certain things like running RubySpec. Look for another post about that soon!


Benchmarking Rails

I've been working on a Rails benchmark for Ruby, like the one Matt Gaudet's RubyKaigi talk discusses. For the short version: we'd like to have a number of Ruby benchmarks for standard workloads like "lots of CPU, not much disk I/O" and "modifying lots of memory, lots of GC time"... And of course "typical Rails application." It helps show us whether a given set of Ruby optimizations are good or bad for the performance of a "typical" Rails app... whatever that means.

There are a lot of interesting questions. What do we benchmark? How do we benchmark it? A benchmark is defined by how it answers those questions. I can talk about what decisions I prefer and why.

(And then smarter people than me will argue for a slightly better set. That's cool. That argument gets way easier if I state my assumptions to start the debate.)

Decisions

For the Rails code to benchmark, I chose Discourse. Discourse is a real Rails-based product with real-world applications. The code is complex, but not so complex you can't understand it. It uses typical Rails calls in typical proportions, insofar as there's is a such thing as "typical" for a mid-sized Rails application.

Discourse has a lot of dependencies. That's why they usually use Docker to install it. I use a local setup script for local development, and (soon) an AWS EC2 AMI for "real" benchmark numbers. I could have used Docker, but Docker isn't great for performance numbers. Benchmarking isn't really what Docker is for. However, a lot of real shops use Amazon EC2 for Rails hosting, so those numbers are useful. Even hosting that isn't done directly on EC2 is sometimes done indirectly on it, via an EC2-based cloud service.

We want a multithreaded benchmark - Matz made it clear that a lot of Ruby3x3's increase in speed will be about concurrent performance. We can use Guilds when Rails supports them. But for now, we have to use threads. A multithreaded or Guilded benchmark won't be perfectly reproducible. But we can get pretty good reproducibility with random seeds for which calls are made in which order.

The idea is that there will be a "standard" random seed that we start testing with -- this guarantees that each thread has a known list of calls in a known order. But we can easily change the random seed to make sure we're not "overtraining" by optimizing too much for one specific call order, even if there's one we normally use for consistent numbers.

The random seed algorithm is very simple. That means that small changes to the benchmark can make big changes to exactly which actions are taken. But it also means the benchmark doesn't have to be hugely complex. The benchmark should change very little over time, once it has been initially debugged. And with a large number of iterations, the total benchmark time shouldn't change much with changes to the random seed.

I'm assuming that we'll be testing with 8 or fewer virtual CPUs, because that's quite common for Rails applications early on. Later, when Rails applications need a lot more parallelism, they tend to have wildly divergent needs -- some are all about I/O, some are extremely CPU-bound. I don't think any one benchmark will do very well for very large Rails applications, but I think a smaller benchmark can be quite representative of small and mid-sized Rails applications. Also, companies that need extremely concurrent Rails workloads are probably doing more of their own benchmarking with their own application. It's reasonable for them to compile a custom version of Ruby with application-specific settings, for instance.

(Nate Berkopec points out that Amazon's idea of 8 vCPUs is actually 8 hyperthreads on four of what a normal human might call a "virtual CPU" or "virtual core." So I'm going to change the load tester to a single multithreaded process, which helps a bit, and see if there is any way I can otherwise improve the ratio of CPUs to processes. I still think CPU contention isn't going to be as big a problem as AWS network overhead when measuring.)

Discourse is already Thin-compatible, so I'm starting with that. Later, I should switch to Puma. Puma is threaded by default (Unicorn is multiprocess, Passenger is multiprocess except for the commercial version, Thin is based on EventMachine.) So Puma seems like the best choice to demonstrate the increased concurrency of Ruby 3x3.

For the benchmark, I'm configuring it as a single EC2 instance with Postgres, Sidekiq, the (one) app server and the benchmark script all configured on the same instance. That is not realistic, but it avoids swamping the benchmark results with AWS-specific problems like noisy neighbors, getting all the instances into the same VPC and running the benchmark from an IP address that's too far from the nearest AWS datacenter. You can, of course, use the same pieces in a different configuration to get your own benchmark numbers. But those aren't the ones I'm generating.

I added a little bit of warmup time to the default benchmark settings. That setting can be changed, naturally. The amount of warmup is a big deal when timing MRI versus JRuby or Rubinius. The more warmup time you allow, the more you give an advantage to JIT approaches where the interpreter starts really slow and speeds up over time.

In addition to the time it takes to complete all the requests, another important factor is startup time: how long from when you run "rails server," does it take to serve the very first request? When you're debugging, recovering from a power outage or restarting a server for a deploy or crash recovery, you care a lot about how long it takes Rails to start up. And when you're debugging, you'll pay that startup cost over and over, so it matters even more.

What Does It Do?

The benchmark basically simulates a set of users loading the app - posting topics, viewing topics and occasionally editing posts. When I talk about a random seed, the seed is for which of these activities occur and in what order.

There are a fixed number of users (5) and a fixed number of requests per user (10,000), and the benchmark is a weighted sum of:

  1. how long it takes to get through each user for each user
  2. how long it takes to get through the fastest one of them
  3. how long the Rails application took to start up
  4. maximum memory usage of the Rails process

There's nothing sacred about that exact list or how it's weighted. But I think those items reward the right things.

If five users doesn't sound like a lot, remember that we're processing the requests as fast as possible. While I'm using the word "user" for these threads, they're more of a measure of total concurrency than a realistic number of requests for a few users. Given the other servers running on the instance (Redis, Postgres, app servers) this means that 8 vCPU cores should be reasonably loaded...

A larger number of users and Rails threads could saturate more vCPUS. But I don't think I can design a representative benchmark for diverse Rails workloads at at that scale. At that many users, the engineering teams should be optimizing significantly for the specific workload of that specific application, rather than running a "typical" Rails application. Above a certain number of simultaneous users, there's no such thing as "typical."

Why Not the Current Discourse Benchmark?

Discourse includes a simple benchmark. It checks only a few specific URLs, one at a time.

There's nothing wrong with it, but it's not what we want to optimize.

Is This What the Whole Ruby Team Uses?

No. This is an early draft. I'm hoping for feedback on my decisions and my code. With luck, this benchmark (or one like it) will become the semi-official Rails benchmark of the Ruby team, just as optcarrot is their most common CPU benchmark.

Right now, there's no Rails benchmark that fits that description.

As Matt Gaudet's talk suggests, it would be great to have different benchmarks for different "typical" workloads. This is just an attempt at one of them.

Source Code?

It's not finished, but yes.

The link above is for a just-about-adequate implementation of what I describe here. My intent is to start from this and improve the code and assumptions as I go. You can comment or submit a Pull Request if you'd like to join the debate. I'd love to hear what you think.

Diving into Japanese for Ruby

I only started studying Japanese recently... But these days, I'm working on the Ruby language, and Japanese turns out to be a big help there. You can find several gaijin learning Japanese to work on Ruby, it turns out.

If you need to pick up Japanese in a massive hurry and you want advice from somebody a few months farther along than you are, keep reading.

First, Get Google Translate

The simplest way to handle Japanese is to let the machine do it. There's a great Chrome extension for Google Translate, and before that you can use it manually (ew.) Some of Translate's output won't make any damn sense. That is normal and expected. But it's still mostly better than nothing.

To get an idea of how useful (and not-useful) it is, I recommend translating this wonderful article on profiling by Yui Naruse. The article isn't available in English, it kinda-sorta works with Google Translate, and you can just about limp through it without knowing any actual Japanese.

So: Google Translate is an okay step one, and really easy. Do that first.


Second, Immerse Yourself

You'll want to be surrounded by Japanese to pick it up. Better, surround yourself with Japanese Ruby stuff.

Google for Ruby stuff and click Japanese links. Read bugs. I'm told there's good Japanese Ruby IRC but I can't seem to find it.

For more, follow Twitter accounts. I've had good luck following Matz, Koichi Sasada and Nalsh. You might also like Yusuke Endoh, Shibata Hiroshi or Akira Matsuda. There are others, and they tend to retweet each other, so feel free to pick up new Japanese developers as you go along.

Twitter offers a second Bing-based translation for each Tweet. Sometimes it's better than Google Translate, sometimes worse, sometimes both will make zero sense. That's how it goes. You can also use Jisho and Rikaikun to translate specific words.

You will, however, start picking up little figures of speech like Koichi's "うーん" (sort of an "uh..." or "ugh..." suggesting that he's tired.) Which is what you're there for - to see Japanese words used by Japanese developers doing Ruby things.

Plus you can start picking apart Hiragana from Katakana and learning common borrowed-from-English words that are used in Japanese. Speaking of which...

Third, Learn the Alphabet(s)

However you start formally learning Japanese, they're likely to start teaching you Hiragana and Katakana, the two easier Japanese alphabets... Or syllabaries. Or whatever you want to call them. Kanji's the really hard one, and you won't learn it immediately. But Google Translate plus Hiragana and Katakana will take you farther than you'd think.

But they'll also teach you to start picking apart sentences into Hiragana, Katakana and Kanji, which lets you start teasing out and learning interesting words, such as "ツール" (tool).

This takes time, repetition and memorization. Which is why you're self-immersing on Twitter and stuff, right?

Also, practice with an app. I like Kana Mind, but there are many.

Fourth, Keep Learning

At some point these stop being "learn Japanese in a massive hurry" tips. Instead, they're just "learn Japanese" tips.

Get a teacher? Yes, it helps a lot.

Books? Sure. I like Japanese the Manga Way and your teacher probably wants you to buy Minna No Nihongo and its English translation (please do.) But do what works for you.

Study buddies? If you can, definitely. Good study partners can be hard to find. But they're really useful!

In general, yes, keep going.

Finally...

Thanks to Al Tobey, who helped me with a lot of my initial jump into Japanese. Several of these recommendations were from him first.

And thanks to the ever-friendly Ruby folks, Japanese-speaking and English-speaking alike.

Since you kept reading this far (thanks!), here's a list of Japanese terms from the Ruby bug tracker. I got them from a Ruby developer on Twitter.

まってる -> feedback
まだ -> open
まつ -> matz
なおした -> closed
なおってた -> closed
なおさない -> rejected


Tales from an Internship: Solving a Race Condition in Twilio Usage

by Ky-Cuong Huynh.

Overview

Interns at AppFolio are entrusted to contribute to real production work. After
2 weeks of training on AppFolio's processes and tools, I had the awesome
privilege of shipping code to production alongside my team every week since.
Along the way, I learned so much under the mentorship of fantastic engineers.
This led to the (technical) highlight of my summer: solving a race condition in
our Twilio usage and saving the company a significant amount of money every
year.

To understand how that race condition arose, here's a quick summary of our
multi-app architecture [0]: our production boxes run Passenger, a fast and
powerful app server. It achieves its speed by coordinating a pool of worker
processes to handle incoming requests. Then, for simplicity, we can think of
each of AppFolio's customers as having their own box that serves up the
AppFolio Property Manager (APM) they know and love.

When APM needs to communicate with Twilio's API, we have an internal app called
Messenger (also running on that same box). It accepts message-send requests
from other apps and acts as a middleman for Twilio, encapsulating all the logic
required. Multiple instances of Messenger may be running on a given box, one
per Passenger worker. As message-send requests arrive from APM, they may be
assigned to different workers. Now comes the race condition. If a customer has
sent too many messages in a 24-hour period, then Twilio recommends purchasing
another number to use. This prevents the first number from being marked as a
spam-sending one by carriers.

Unfortunately, more than one Passenger worker may believe it is necessary to buy
another phone number from Twilio, even if only one more number overall was
required. Thus, a customer may end up with more numbers than needed. That
introduces an unnecessary recurring expense for AppFolio, one that increases as
we have more customers.

Now, this was a known race condition. The team that built Messenger added a
lock around the provisioning code (our critical section/region). Alas,
Messenger instances can enter/exit the region one after the other. Even if only
one worker process executes the code at any point in time, we still end up with
multiple executions of the provisioning code.

Our solution: check if provisioning is actually necessary while inside of the
critical region. In other words, we added a check that asks, "Do I actually
need another phone number, or has enough sending capacity already been added?".
In the end, we spent far more time reasoning carefully than we did coding,
which is a common occurrence for complex real world problems.

Background

The bulk of my summer was spent working with my team on bulk texting
functionality. Our work empowered property managers to easily text whole units
or properties at once. Along the way, carrier limitations meant that we had
extended our messaging architecture to potentially map many phone numbers to
each customer. Towards the end, I learned of the interesting race condition
in question and began analyzing it. But first, some context.

Twilio's Quotas

At AppFolio, we use Twilio to send text messages.
Twilio recommends a rolling quota of 250/messages per 24-hour period. "Rolling" means that old messages no longer count against the quota once 24 hours have elapsed from the time they were sent. We can think of this a conveyor belt of messages, each of which returns to us for use after 24 hours. Note also that this is a soft limit, meaning that Twilio doesn't enforce this strictly. Rather, if we send more than 250 messages/24 hour period for a single phone number, that number risks being marked as a spam number by carriers. If a number is marked as a spam number, then its messages may be silently filtered out from ever reaching their recipients.

There's one more wrinkle. When a conversation is seen as "conversational" by carriers, there is a higher threshold for blacklisting numbers as spam senders. These also vary by carrier, but Twilio recommends 1,000 messgages per (rolling) 24-hour period when a communication is more 2-way. To be safe, our internal limits model this conversational threshold as a +1 to the quota for every message received.

Sending Messages Using Messenger

Messenger is essentially our internal middleman for Twilio. Every app that needs to send text messages can do so by sending a request to Messenger, which will handle the back-and-forth with Twilio. Messenger itself presents a set of JSON APIs that are message-oriented. It's designed to take in requests for sending a single message. It has no concept of groups/batches of messages
(which is something we considered adding to speed up sending bulk texts).

Here's an overview diagram:

apm_bundle messaging architecture

The Race Condition

To make things more concrete, we'll walk through the code flow for sending a bulk text.

In Property, our TenantBulkSmsService is invoked to create a background job for sending requests to Messenger. Messenger receives the request from Property and sends the message using TwilioInterface::Sender.send_message:

class << self
  def send_message(body:, to_phone_number:, ignore_sending_limit: false)
    # Check customer quota and message length
    raise DailyLimitExceeded, # ... 
    raise BodyTooLong, # ...

    # RACE CONDITION entrance: we potentially provision as part of the
    # Twilio configuration
    config = verify_and_load_twilio_config

    # Send message with the proper parameters
    prepared_message = TwilioInterface::PreparedMessage.new(body: body, to_phone_number: to_phone_number)
    response = config.twilio_subaccount_client.send_message(
      # From:, To:, Body:, etc.
      # ...
    )

    # If here, successful message send
    TwilioInterface::Sender::SuccessfulResponse.new(twilio_response: response)
    # Else, Twilio error handling
    rescue Twilio::REST::ServerError
    # ...

That verify_and_load_twilio_config method leads to the retrieve method here:

module TwilioInterface
  class PhoneNumberManager
    class << self
      def retrieve
        # RACE CONDITION: more than one Messenger instance
        # may find this condition to be true and proceed to provisioning logic
        if need_provision?
          TwilioInterface::PhoneNumberProvisioner.provision!
        end
      end

      # Other class methods
      # ...

That need_provision check is later down this same file:

def need_provision?
  if Experiments.on?(:texting_quota)
    (TwilioInterface::DailyLimitChecker.current_amount_under_limit < 1) && !reach_max_capacity?
  else
    !provisioned?
  end
end

The race condition occurs here: more than one Passenger worker process (running Messenger) may
enter this method and find TwilioInterface::DailyLimitChecker.current_amount_under_limit to be < 1. Then, they would all proceed to TwilioInterface::PhoneNumberProvisioner.provision!:

def provision!(purchase_filter = {})
  create_new_number(purchase_filter)
end

So we go to create_new_number:

def create_new_number(purchase_filter = {})
  # RACE CONDITION consequence: multiple Passenger workers
  # may enter this critical region one at a time and each
  # purchase an (soon unnecessary) number
  lock = Lock.first
  lock.with_lock do
    unless PhoneNumberManager.reach_max_capacity?
      # Provision new phone number
      # ...
    end
  end

  rescue Twilio::REST::RequestError => e
    raise TwilioNumberNotPurchasable, e
end

This is where the phone number purchase actually occurs. Notice that the
purchasing logic is protected by a lock. This is a leftover from when a
previous team originally implemented this code and noticed the race condition.
They solved it for the single phone-number case, but now we had to generalize
to multiple phone numbers. At this point, my mentors and I understood the
race condition and were ready to solve it.

Aside: A Database-based Lock

You may have wondered why we're not using the Mutex class built into Ruby's standard library. In fact, if we dig into that Lock implementation, it's just using a single row in a table on the database. So why are we using the database to implement a lock?

Here's why: our issue is not coordinating multiple threads on a single machine (or guarding against interrupts with a single thread), but rather multiple processes that are potentially across multiple machines. This is because customers may have more than one physical box running Passenger (though this race condition can still occur in the multi-process, single-box case). Any mutex we create would only exist in the memory of one of those boxes.

What stops this from becoming a full-blown distributed systems problem is the fact that everything in a box shares a single database. We can leverage that shared database to coordinate/synchronize access to this piece of code. This is possible because MySQL uses its own locks as part of achieving its ACID properties. Then, the biggest users of those locks are transactions.

To make use of all this, the Lock#with_lock [2] method simply wraps the passed-in block code in a transaction. To test this unusual lock, we opened two Rails consoles and had one try to enter the critical region after another had already done so. We found that the lock did indeed prevent access, at least until it was released. Note, however, that ActiveRecord appears to have a default timeout for how long to wait to acquire a lock.

The Fix

The fix for this race condition is surprisingly simple. At its core, we face the issue that Messenger processes are checking against how many phone numbers a customer may have, rather than the capacity they may have already gained. So, we simply add this check to the critical section:

def create_new_number(purchase_filter = {})
  lock = Lock.first
  lock.with_lock do
    if TwilioInterface::PhoneNumberManager.need_provision?
      # Provision
      # ...

And recall that that check looked like this:

def need_provision?
  if Experiments.on?(:texting_quota)
    (TwilioInterface::DailyLimitChecker.current_amount_under_limit < 1) && !reach_max_capacity?
  else
    !provisioned?
  end
end

Now, a natural question is "Why wouldn't we simply add the database-based lock around the first need_provision? check?"

Answer: because that method is called for every single message to be sent, whereas actually provisioning more numbers only happens on occasion. Whenever locks are used, we're defining a critical region of code that can only be accessed by one process at a time. This makes a tradeoff of safety vs. speed. Putting a lock around the first need_provision? overly widens our critical region and reduces message throughput.

Verifying the Fix

To check the fix, we'll want to modify some of our method calls to simplify testing. To start, we'll stub the provisioning logic lock to let us know
what occurred:

def create_new_number(purchase_filter = {})
  lock = Lock.first
  lock.with_lock do
    if TwilioInterface::PhoneNumberManager.need_provision?
      PhoneNumber.create!(
          twilio_subaccount_id: 7,
          sid:                  "#{Random.rand(100)}",
          number:               "+#{Random.rand(100)}",
          friendly_name:        "+#{Random.rand(100)}"
      )
      puts "I provisioned a new number!"
    else
      puts "I did not provision a new number"
    end
  end

Next, we modified the database and calls so that the first number is exhausted. Note that test messages must be dated for today because of the 24-hour rolling quota!

And when we run:

TwilioInterface::PhoneNumberProvisioner::provision!

Then, the first console says, "I provisioned a new number!", but the second console to execute this gives, "I did not provision a new number". Race condition resolved! We were also able to devise a test case to guard against regressions. That test now runs as part of every continuous integration (CI)
build.

If anyone has any questions, I can be reached on Twitter or via email at kycuonghuynh@ucla.edu.

Appreciations

Thank you to Yunlei and Magne for collaborating with me on this.
You were both amazing mentors and truly made my summer. I've grown so
much under your careful guidance and I can't wait to keep learning and building.

Thank you to Flavio for regression testing this fix. AppFolio cares highly
about the level of quality delivered to its customers and you serve as a
strong advocate for them.

Thank you to Jingyu and Chris (authors of the original Messenger code) for encouraging me to pursue a fix and then helping me understand Messenger.

Finally, thank you to Andrew for letting me write about this, as well as editing this post and recruiting me to AppFolio.

Footnotes

[0] A review of the concurrency material from OSTEP, a free operating systems textbook, can also be helpful.

[1] Using a code texted to a device as part of login is really using 2SV,
second-step verification, since the code is still a piece of knowledge.
This belongs to the the same class of factors as passwords ("something you know"). A Yubikey or biometrics requirement would constitute a true second factor ("something you have" and "something you are", respectively).

[2] It is Ruby convention to refer to instance methods in documentation via ClassName#instance_method.

Internships at Appfolio

At Appfolio we take pride in having a high quality internship program.  This year, at the end of the summer, two interns chose to write up their thoughts on the summer that the spent with us.

Christopher Chen, from Berkeley, had the following to say about our software engineering internship:

When I first started at Appfolio, I had two prior technical internships, the first at a very large company, and the second at a small company. Neither of them were what I’d call inspiring and the first actually made me question majoring in computer science. Starting in October of my junior year, I applied to many of the large, well-known, Bay Area tech companies with mixed responses. Appfolio was an afterthought at the time since I’ve never heard of the company before. Weighing the offers of multiple companies, I eventually chose to go to Appfolio due to its strong employee satisfaction on Glassdoor.

Soon it was mid-May, the end of my second semester as a junior, and the beginning of my internship. I was unsure of what to expect - my friends were interning at large Bay Area tech companies, meanwhile what well-known tech companies are located in Santa Barbara? (surprisingly many, as it turns out) 

My concerns were put to rest on the first day; interns were given Macbook Pros to work with, in a modern office setting with desks that could go from standing to sitting height at the touch of a button. Snacks were a-plenty and it was overall a great work environment. 

I began with a 2-week training session in Ruby on Rails, building enough technical knowledge to begin working in a team - I would continue to learn as I developed new features. I also participated in team decision-making and it struck me how seriously I was being taken, even as a fresh intern. The team welcomed my ideas and almost immediately I was accepted into the team, not as an intern, but as an engineer. 

As I type this sitting at my desk on my final day after 3 months, I reflect on how different this internship was from my previous one. At one of my previous internships, my mentor was a man who was well-known in his field, regularly taught graduate classes, had many patents under his name, and was otherwise very respected. However, I was lucky to get an hour per week from him. Here at Appfolio, Natalie, my very bright and hardworking mentor, was always willing to spend time with me. Under her guidance, and that of the entire team’s, I built many customer-facing features, those that would later bring about highly positive customer feedback. Through being productive, I also learned more than I did at any other internship. Beyond technical skills (like learning an entirely new language and web development stack), I also learned and refined social skills like working effectively in a team setting and buying in on the company culture.

The main difference, and the best one, was how much trust I was given. I hit the ground running with a non-trivial project (unlike those of my previous internships) that was immediately utilized in the live release. I was able to directly speak to customers about features they want and needs they need fulfilled. What I was able to get done was fulfilling for the customers and for me - it was my first experience as a “real” engineer in a software company, not the intern whose time was worth little.


Sophia Zheng, also from Berkeley, had this to say about our product management internship:

Adjusting to a new workplace can be hard for anyone, but AppFolio has a way of seamlessly incorporating interns into the company. During my first couple weeks at AppFolio, I attended several sessions that taught me the skills I needed to be an effective employee. 

From there, I was put on two teams that were working on features that would go live to all customers, and I think this is what distinguishes an AppFolio internship from other internships. Instead of putting all the interns on an intern project that may or may not be used in the end, interns are given the same responsibilities as regular employees. As a product intern, I was given my own feature to product manage--I can’t say that’s common for many other product management internships. I got my own product management experience, from working with developers and user experience to contacting customers for research. During my internship, we pushed out two major stories for the feature I was in charge of to all customers. 

I was also given two other projects: I got my own personal research project and I was put on a market validation team. During market validation meetings, my thoughts were acknowledged and taken into consideration, and the results of my research were taken seriously. 

AppFolio truly does an amazing job at making sure interns do work that matters to the company. I will say this though: if you take an internship at AppFolio, also be prepared to play a lot of foosball.