Rails Ruby Bench: What Is It and Why Should You Care?
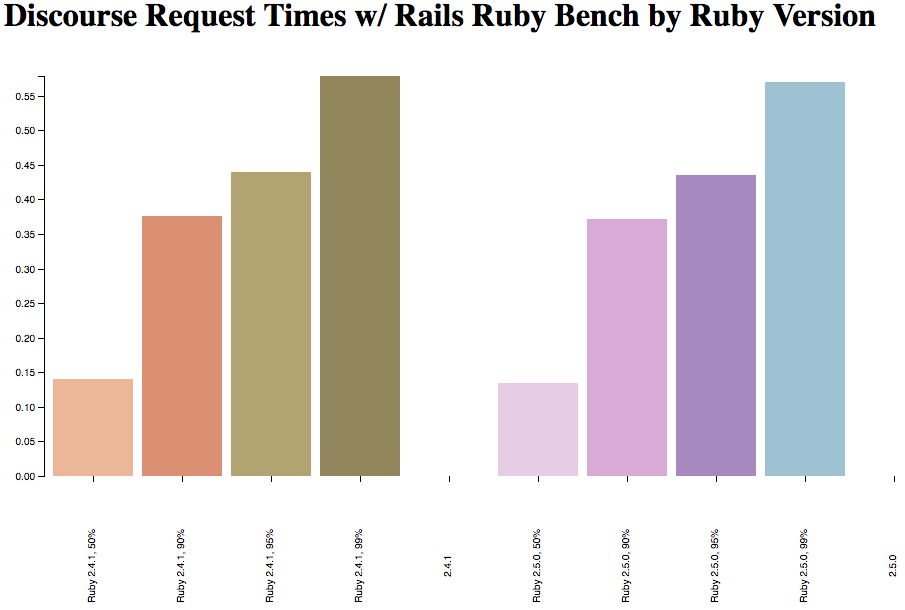
Recently the brilliant and accomplished Chris Seaton asked me what the difference was between Rails Ruby Bench and the normal Discourse benchmarks, as seen on ruby-bench.org.

Plus I keep writing about RRB and linking to the code on GitHub. That's not terrible, but it's not exactly friendly. So let's talk: what is Rails Ruby Bench? Why should you care?

(Spoiler: if you mostly care about Ruby on Rails performance on a big server or VM, Rails Ruby Bench is the closest to "your" benchmark for Ruby that you'll find.)

The Very Basics: What Is RRB?

Rails Ruby Bench uses Discourse, a real-world Ruby on Rails app, and a simulated realistic workload to benchmark the speed of Ruby. So: what is "real-world"? Let alone "simulated realistic workload?"

First off, if you have 40 minutes here's what I said about that at RubyKaigi in Hiroshima in 2017, along with a lot of the information about Ruby's speed that came from RRB. I'm pretty proud of it!

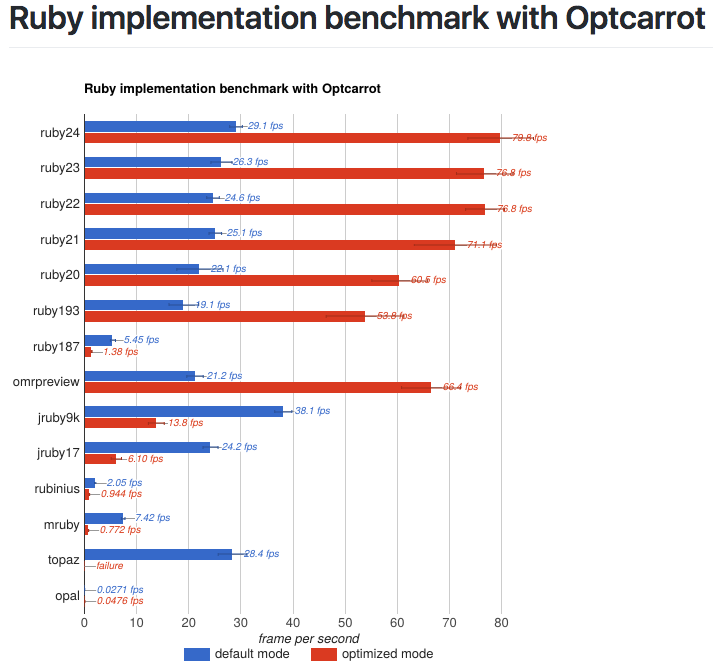
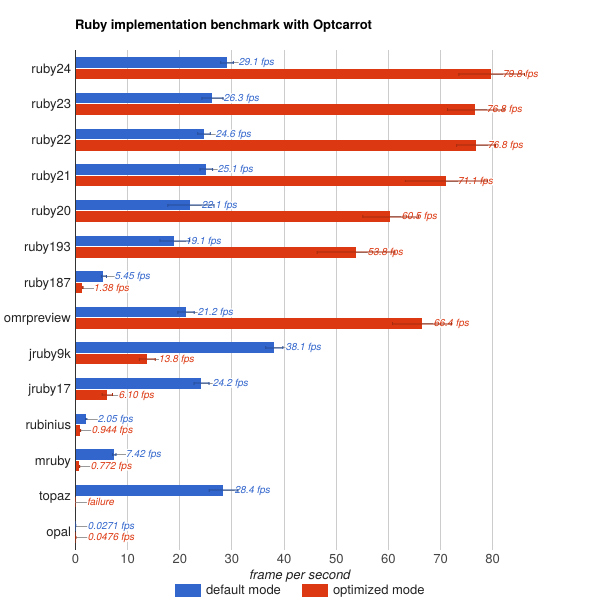
But for the quick version: Ruby benchmarks historically tend to be about the language's raw speed, and tend to be pretty small. OptCarrot is a great example - a very solid benchmark that still doesn't use Rails or concurrency or much garbage collection. A benchmark like that is really easy to work from and it has a lot to do with the language itself. That's exactly the kind of major benchmark you want if you're implementing a language. Which is why they did!

But when you're telling the community about your speedups, folks want to know: but what about lots of threads or processes? What about I/O-bound and memory-bound applications? And in Ruby they ask, "but what about Ruby on Rails?"

Those are great questions. RRB tries hard to answer them.

How Does It Do That?

Rails Ruby Bench uses a real-world, typical, in-production open-source Ruby on Rails app as its basis. That would be Discourse, software for forums built by a real commercial company. It has all the little hairy bits of DDOS-protection and security and stuff that Real Apps do and benchmarks usually do not. Then it generates a lot of repeatably-random but realistic HTTP requests browsing through topics, saving drafts, posting comments and so on. It mimics a lot of users doing their thing and determines how much load Discourse can process with that Ruby version, basically.

RRB uses a large dedicated EC2 instance and loads it up to full capacity, running flat-out. Then it measures how fast 10 processes and 60 threads can process the requests. This is a pretty realistic setup and looks a lot like how small-to-mid-size startups do it and what they care about.

It's a benchmark, so what does it do badly? It runs the load-test process and the database on the same instance as the benchmark - that's great for low-variance results (no network, no noisy neighbors) but is absolutely not a realistic setup. It also runs with only a single application server and no load balancer, so it tests nothing about the scaling of load-balancing or the database. That's because it's a benchmark for the Ruby language, and neither of those components normally use Ruby. Similarly, it runs without a reverse-proxy in front (no NGinX) and the load-tester doesn't request static files -- I want to test Ruby, not NGinX.

Other good things about RRB: its basic setup has been vetted by luminaries like Nate Berkopec, Richard Schneeman, the aforementioned Chris Seaton and others. I've changed a number of things to reflect their observations and/or my previous screwups. So it's battle-tested.

It's also shown some fairly interesting things about Ruby's speed. Again, I recommend my RubyKaigi 2017 presentation for even more details.

More for Pedants (Scroll Past If You Don't Care)

What about failed requests? If any request generates a 500-series error I throw away the whole run, normally between 4,000 and 6,000 requests, depending on what's being benchmarked. As Ruby gets faster and I measure smaller effects, the number of HTTP requests per run has to go up to get accurate results.

I most frequently run with one warmup start/stop iteration, and 100 warmup HTTP requests. If I use a different number than that, I'll say so in the specific post about it. It's configurable when you run RRB.

I've used multiple Discourse versions over time, and I update slowly over time. It's hard to keep RRB usable across many Discourse versions as the code and HTTP request format changes -- that's just a hazard of using a real-world app.

Why RRB Is Different

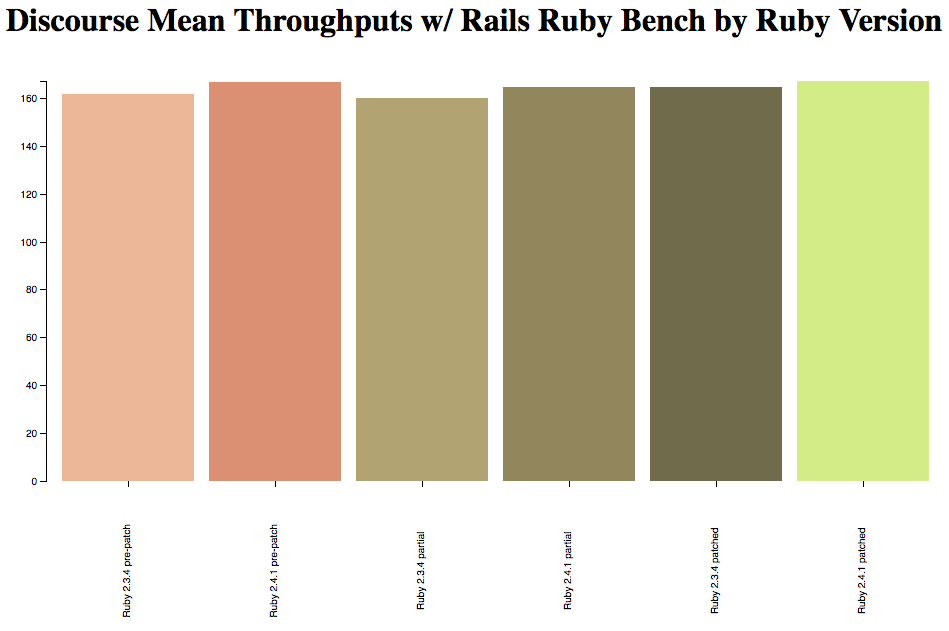
The standard Discourse benchmarks request the same URL many times in a row using ApacheBench, then measures the speed with a simple "best time out of N" metric -- though it also does one run where it measures the memory usage. RRB requests different URLs in different orders with different parameters, which affects the speed of the resulting benchmark and gives a "blended" result from many different URLs. As a result, you'll often see Ruby optimizations where different standard Discourse benchmarks give different amounts of optimization and RRB shows a weighted average of those speedups - sometimes a particular Ruby optimization is much faster for some URLs than others.

Smaller benchmarks like OptCarrot often give very different results than RRB. They tend to measure CPU time, while RRB effectively measures memory and I/O performance as much or more -- it's a bunch of parallel Ruby on Rails processes running in Puma, so CPU time isn't the be-all end-all that you see in a much smaller process.

RRB's primary difference from straight-up I/O or garbage collection benchmarks is that it does measure CPU performance. You might expect Ruby on Rails to not care about CPU performance, and to be purely CPU- and memory-bound, but that's not what RRB's results show. There's plenty of room to optimize Rails by optimizing CPU performance, though that's not the whole story.

Is Rails Ruby Bench All Done Now?

Benchmarks often have a kind of "shelf life" built in - by their nature they show a single metric, and at some point you've gotten nearly all the benefit from that metric.

And RRB has needed some adjustments - Discourse version upgrades, for instance, and running more full runs and more HTTP requests per run.

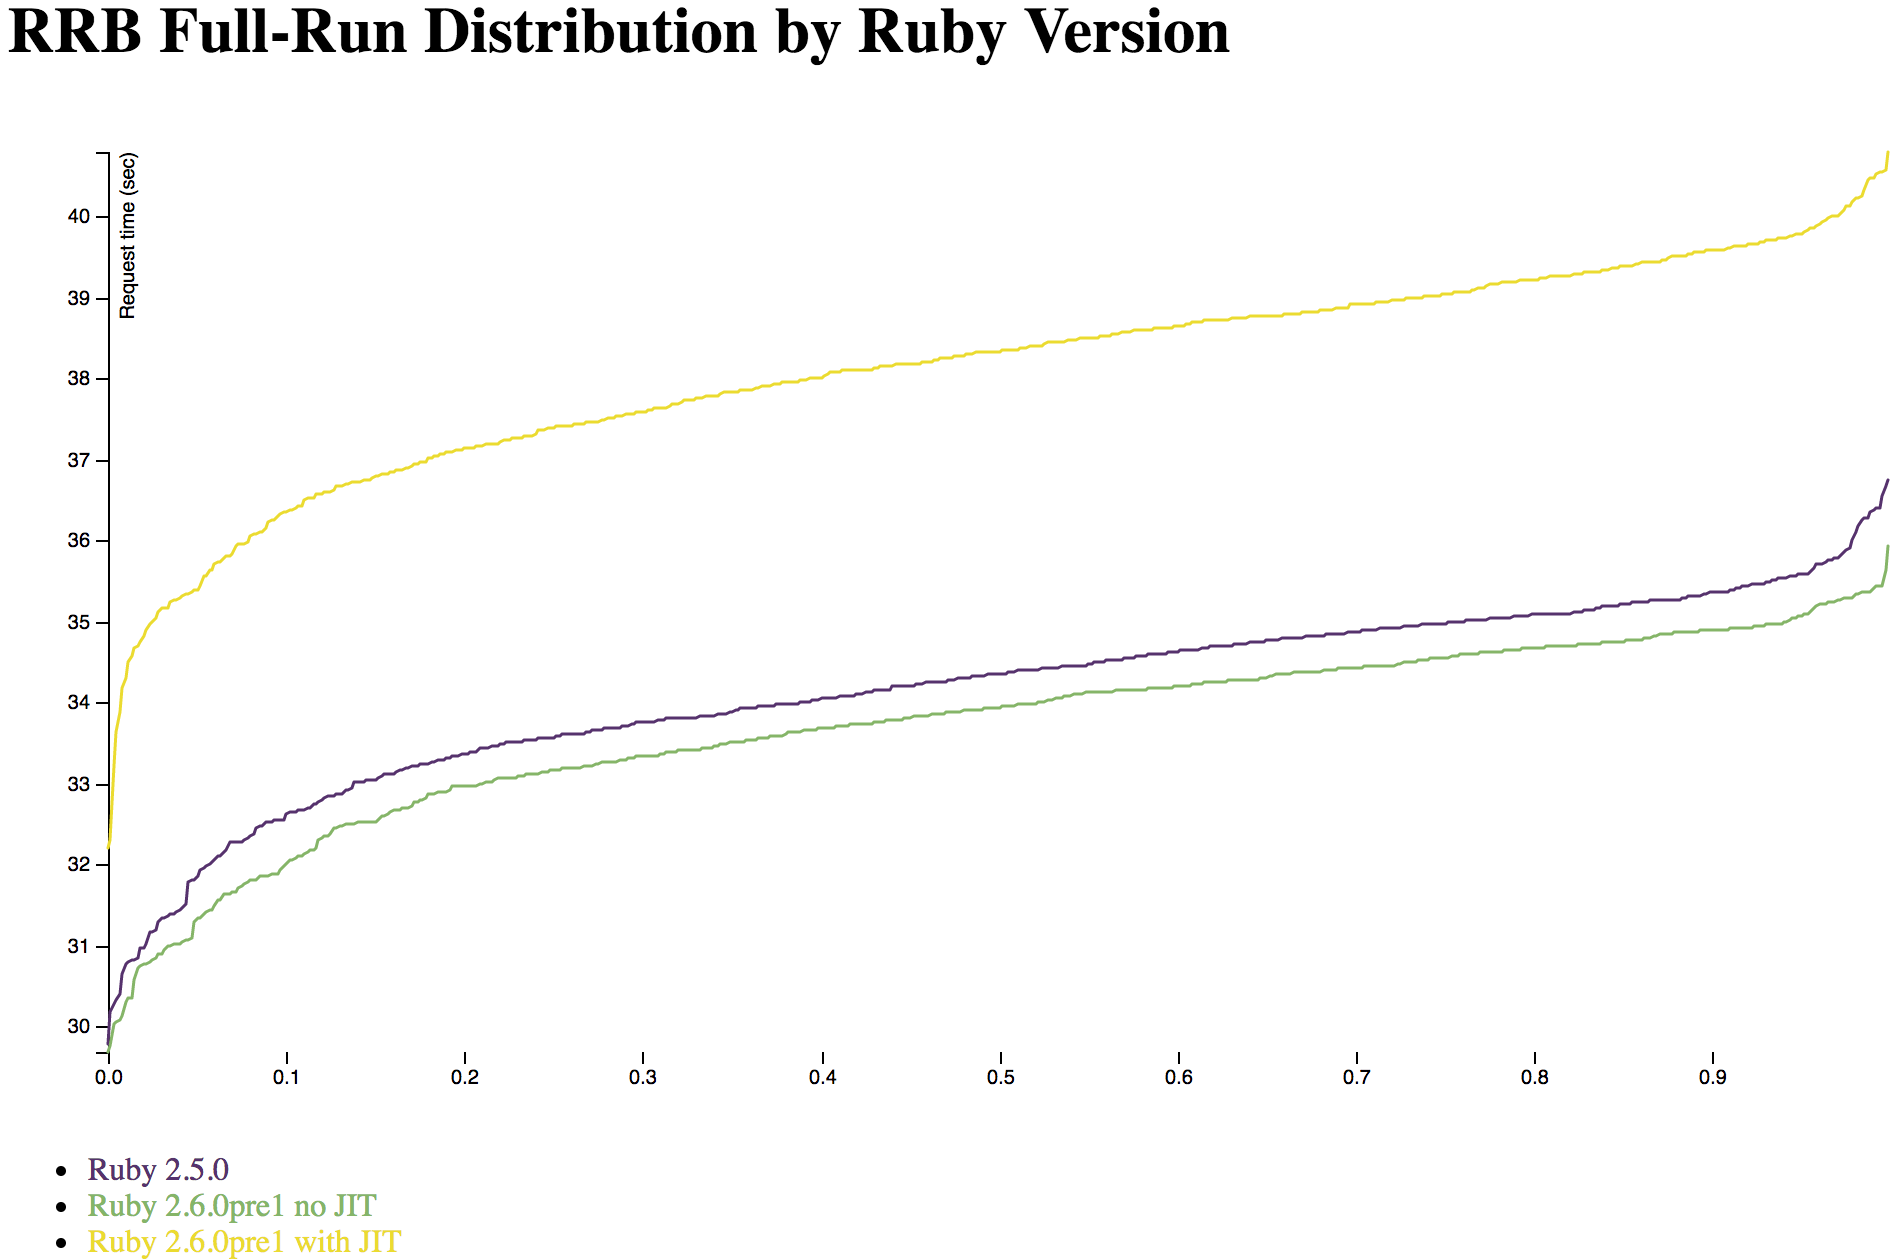
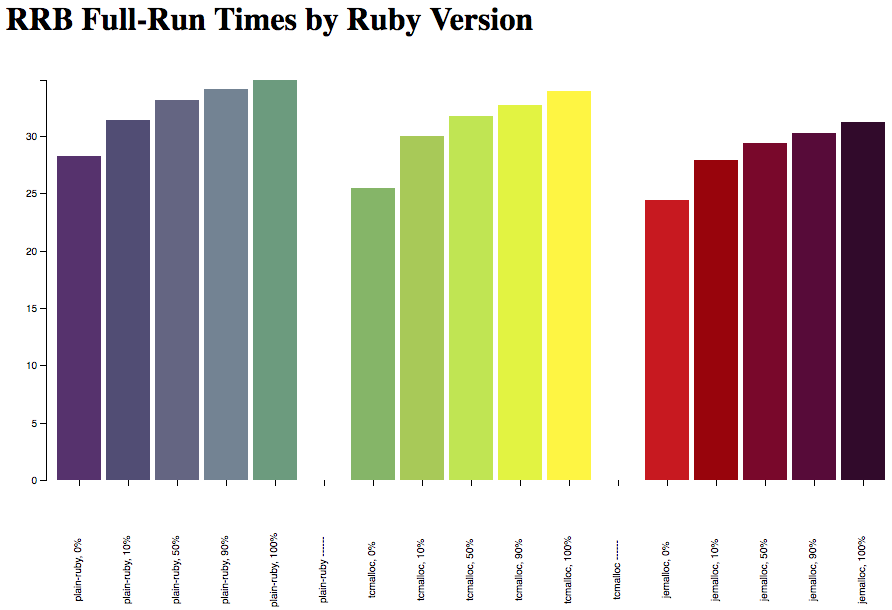
The best evidence I can give that Rails Ruby Bench isn't done is this: I keep finding new, interesting slants for it. Right now (April 2018) I'm trying to measure how much extra speed you can get from Rails by saving memory, and using RRB to do it. I'm trying to figure out how much of MRI's warmup time (it has some!) is from the memory setup and can be removed with environment variables. And soon, RRB will be my go-to metric to see: does JIT speed up Rails? What settings work best?

I think Rails Ruby Bench has more interesting questions to answer in the next year or three. There will, of course, be new efforts of all kinds. And Ruby 3x3 could use more benchmarks as well. But RRB isn't done yet.


Ruby 2.6 preview 1: Timing JIT

The new Ruby 2.6 preview 1 has JIT capability built in. Awesome! But it's still early. They say JIT doesn't help on Rails apps, for instance.

Purely by coincidence, I happen to write a big concurrent Rails-based benchmark, which Takashi was hoping to see JIT results for. And I'm freshly back to part-time work after paternity leave.

So how is its performance for Rails apps? Let's find out.

(Disclaimer: Takashi says that 2.6 head-of-master has significantly better JIT performance than prerelease 1. And I'll get around to timing that soon, too. But for now let's go with the 2.6 prerelease.)

Some Graphs

There's a way I usually graph this stuff. And several people have pointed out that I could do better with a line graph. And they're right, I totally could. So let's look at this how I usually do it, and then with some (I think) improved graphs.

I like the rainbow thing this graph has going. It's pretty. But commenters are right that it could be much clearer.

I like the rainbow thing this graph has going. It's pretty. But commenters are right that it could be much clearer.

That bar graph lets you know: Ruby 2.6.0 prerelease 1 isn't much faster than 2.5.0. But how close? And the 2.6.0 bars with JIT (far right) are higher, so it's slower. But how much higher/slower? I usually clarify with a table, which kind of makes the graph redundant. Here's what that looks like:

Percentile Ruby 2.5.0 Ruby 2.6.0 w/o JIT Ruby 2.6.0 w/ JIT speedup w/ 2.6 speedup w/ 2.6 JIT
0% 29.79 sec 29.69 sec 32.21 sec 0.35% -8.13%
10% 32.62 sec 32.01 sec 36.34 sec 1.85% -11.42%
50% 34.35 sec 33.94 sec 38.34 sec 1.20% -11.60%
90% 35.35 sec 34.89 sec 39.58 sec 1.30% -11.95%
100% 36.75 sec 35.92 sec 40.79 sec 2.25% -11.01%

It says pretty much the same thing: Ruby 2.6 is a tiny bit faster (let's call it 1.5% faster.) And with JIT it's much slower, more than 10% slower. Keep in mind this is a big, highly-concurrent Rails-based benchmark, which is exactly where we were told JIT was slower.

Still, we can do a better job presenting this data, I think. What if, instead of looking at a few representative percentiles of the full-run times, we took all 120,000 requests per Ruby (20 full runs, each with 6,000 requests,) sorted them from fastest to slowest, and overlaid them like a CDF? I think that would give us a pretty good view of how much faster or slower it is. Here's what that looks like:

I don't feel like this is as pretty. There are things I could do to improve it, obviously. But the biggest problem is that it's hard to estimate the total area between the curves in a wide, shallow graph like this. But I agree - this is an improveme…

I don't feel like this is as pretty. There are things I could do to improve it, obviously. But the biggest problem is that it's hard to estimate the total area between the curves in a wide, shallow graph like this. But I agree - this is an improvement.

Note that a small difference like the one between Ruby 2.5 and 2.6 is the worst case for a graph like this. It's about a 1.5% difference, as we saw in the table above. In fact, it's much smaller than that -- the 1.5% difference was aggregated and included a lot of the longer requests, while most requests on this graph are nearly the same between Ruby versions. Very few graphs will do a good job of showing that. And even the 2.6 with/without JIT difference isn't massive, at around 10%. Still, it's hard to recognize even the biggest, most important features of this graph, such as the fact that the slowest requests, with JIT, are much slower. And that's what you'd hope a graph like this would be best at.

Still, it's worth a look at the full-run version rather than the per-request version. Anything that shows every individual request, all 360,000 of them, is going to be, at best, too much information. What about just the 18,000 most important points, the aggregated run times?

Here's what that looks like:

This makes you appreciate the buttery smoothness of the version with far too many points, doesn't it? 18,000 points sounds like a lot when I write it, but it's not really that huge.

This makes you appreciate the buttery smoothness of the version with far too many points, doesn't it? 18,000 points sounds like a lot when I write it, but it's not really that huge.

This is the clearest graph so far, no question. By aggregating the full-run times, you can see that there's actually a lot of difference between the Ruby versions, even if most individual requests are very similar. In 6,000 requests, nearly every run is going to have something that is faster in 2.6, or much slower in 2.6 with JIT.

Also, the Y axis is zoomed in here. Notice that it runs from around 30 to 40 seconds, which is the basic spread for a full run of 6,000 requests for this benchmark. The individual-request graph had to start at zero because some requests are nearly instantaneous, while others take upwards of a second. This lets you see a lot more clearly what it means that the green and purple lines are "about 1.5%" apart - the fastest runs are very close together, the vast majority of runs are nearly a constant factor apart, and there are a few at the end that are outliers -- barely. As graphs go, this is a very orderly, neat one rather than a noisy one with lots of weirdness. Right now, Ruby 2.6 is a small, simple, uniform optimization and its JIT is a smallish, simple, uniform slowdown to this benchmark.

Methodology and Conclusion

Right now you don't want to use Ruby 2.6 JIT for your large, highly-concurrent Rails app, just like it said in the prerelease announcement. That makes sense. And don't worry, I'll be timing the newer 2.6 versions very soon. You'll find out when JIT breaks even for Rails Ruby Bench, and when it gets faster. I'll also try playing with different JIT settings a bit -- if I find anything interesting, I'll let you all know.

In case you haven't read my other articles on Ruby speed, this is all measured using Rails Ruby Bench (aka RRB.) RRB preloads Discourse with a bit of data and runs with with 10 Puma processes and 60 threads, then shoves pseudorandomly-generated HTTP requests through as fast as possible on a single large EC2 dedicated host. This gets more predictable benchmark results than you'd think, for reasons you can read about in my previous posts and on GitHub.

So: when you read about "how fast Ruby 2.6 prerelease 1 is" in this article, you're finding out how its speed looks for a large, real-world, highly-concurrent Rails workload. Other workloads will vary -- the Ruby 2.6 JIT is much faster on optcarrot, for instance.

Benchmarking Ruby's Heap: malloc, tcmalloc, jemalloc

Last week's post talked about different kinds of Ruby objects: some are contained in the 64-bit reference directly, some use up a 40-byte "Slot", and some use a Slot and a chunk of heap. Let's talk about that last set of objects.

"The Heap" isn't specifically a Ruby concept. It's a standard part of Unix processes. Other than garbage collection, Ruby doesn't do much that's special or unusual with the Heap in its processes. So: what's there to talk about?

It turns out that the heap does get managed. The C standard library has a "normal" malloc. But memory allocation is like everything else run by programmers: you have a bunch of different choices with subtle differences between them. And so you have several memory allocators to choose from. There are smart folks who strongly favor nonstandard allocators like tcmalloc and jemalloc, and get great results with them.

Also, I haven't measured anything with RailsRubyBench in a little while. I get itchy. You know how it goes.

(Do you just want to see the pretty graph? I totally understand. Scroll down, it's near the bottom after the explanation.)


What Does Malloc Do?

I won't dive too deeply into malloc -- the information is out there, and mostly it's not what you need to know for Ruby. But let's hit the basics.

Your process uses memory "pages" which it requests from the operating system. They're usually 4 kibibytes (4096 bytes), though it can get complicated. Your memory allocator figures out when to ask the operating system for new pages. It manages chunks of memory that usually aren't 4096 bytes, the ones your program asks for. If you return them later, it manages those too. So it often winds up with a kind of memory Swiss cheese as your Ruby program asks for various sizes of objects and hands them back in a different order.

(Doesn't Ruby use garbage collection? Sure. But when it frees your object automatically, it turns around and frees up that memory using whatever malloc implementation it's using. Just because you don't manually free the memory doesn't mean Ruby doesn't do that. Ruby is written in C, and behaves like it.)

Malloc needs to keep a list of what memory is used and free. It needs to update that list when you allocate or free memory in the Heap. You're asking for more Heap when your process asks for a Page full of Slots. But you don't touch the Heap when you use a Slot in a Page that Ruby already has.


What's the Difference?

If you enjoy reading C code, may I recommend the Dan Luu tutorial on implementing a really basic malloc? It's a great way to start thinking about what malloc does and how it does it. Of course, real malloc is normally a lot more complicated, but it's a good start.

There are a few different commonly-available malloc implementations, aside from whatever version came as part of your C standard library.

The two we'll talk about today are called tcmalloc and jemalloc. You can build or run Ruby with either one. Tcmalloc is part of the Google Performance Tools suite and keeps a thread-local cache for each malloc so you don't have to go to a single big pool of memory for every allocation on every thread. That's not going to help much for an only-processes Ruby application that doesn't use threads... But Rails Ruby Bench uses threading pretty heavily, so you'd think tcmalloc could help a lot.

Jemalloc is the old FreeBSD allocator, separated from FreeBSD. Like tcmalloc, it keeps per-thread chunks of memory and tries to avoid memory fragmentation. It comes highly recommended by Ruby performance luminaries like Nate Berkopec. Both allocators are good, and there are a few interesting differences between them.

So, shall we have a speed shootout?


How Fast?

I'm going to use Ruby 2.5.0 and Rails Ruby Bench for this. So I'm answering the question, "for a big concurrent Rails benchmark, what's the difference in total speed/throughput?" Memory benchmarks are a little odd this way. I'm measuring speed, but making some changes that clearly affect total memory usage. But the memory usage is basically capped by the fact that it's a single m4.2xlarge dedicated EC2 instance running ten Rails processes. So this benchmark answers how better memory efficiency translates into speed with a constant amount of memory, not how little memory you can use.

(Why do we care exactly what/how this measures? For starters, because there's probably a better way to tune Puma for lower memory usage per process. This shootout probably understates how much faster a more efficient malloc is, because it starts with a benchmark that has been carefully tuned for normal system malloc. You might be able to get better throughput with more Puma processes, for instance, or more threads per process. This benchmark doesn't measure that.)

So, what do we measure? I started with normal Ruby 2.5.0, and Ruby 2.5.0 with jemalloc and tcmalloc. I also tried using the memory environment variable settings the page suggested for tcmalloc, but they're entirely within the margin of error - in this benchmark, warmup is serving the same purpose, so on-boot memory settings don't matter enough to be measurable.

jemalloc_tcmalloc_full_runs.png

These are full-run times with Rails Ruby Bench, measured in seconds. In case you're not already familiar with RRB, I'm running Discourse with 10 processes and 60 threads on an EC2 dedicated m4.2xlarge instance in a don't-use-the-network configuration to reduce variation. It's a configuration that's meant to answer, "what's the speed difference for a highly-concurrent Rails application, running as hard as my fairly-large EC2 instance can handle?" There's a 30-thread load tester processes running 6000 requests/batch, and each of these configurations was tested for 60 batches. 60 batches of 6,000 requests gives 360,000 HTTP requests for each configuration. I throw out any batch that has an HTTP error, but in this case none of the 180 batches got any errors. It does happen for some benchmarks because HTTP is like that.

That graph is reasonably pretty, but it's hard to pull a specific percentage out. Let's put the numbers in a table and check percentages, shall we?

Percentile CRuby 2.5.0 2.5.0 w/ jemalloc 2.5.0 w/ tcmalloc speedup w/ tcmalloc speedup w/ jemalloc
0% 28.22 sec 24.45 sec 25.45 sec 9.82% 13.38%
10% 31.41 sec 27.86 sec 30.03 sec 4.40% 11.30%
50% 33.13 sec 29.40 sec 31.72 sec 4.27% 11.25%
90% 34.12 sec 30.28 sec 32.70 sec 4.15% 11.25%
100% 34.87 sec 31.17 sec 33.90 sec 2.80% 10.62%

Overall we're getting about an 11% speedup with jemalloc here, and a much more variable speedup, between 3% and 10%, with tcmalloc. That makes sense, and matches the reports I've heard of both jemalloc and tcmalloc. Note that this is with no additional tuning (e.g. no change in the number of processes or threads,) and none of these got a single server error in the 360,000 requests they each handled. So: reasonably solid.

(I've run these numbers and gotten as low as 9% speedup for jemalloc before as well. But the speedup is still in a similar range.)

When I check throughput rather than runtimes I usually get a smaller speedup - total throughput uses the slowest of the runs as the total time, so it nearly always shows less speedup. What's interesting here is that that's clearly true of tcmalloc... But jemalloc gets great results on throughput, suggesting a very consistent speedup (as you see above as well):

CRuby 2.5.0 jemalloc tcmalloc increase w/ tcmalloc increase w/ jemalloc
Median Throughput 175.13 req/sec 197.49 req/sec 183.33 req/sec 4.68% 12.77%


Conclusions

It looks like the jemalloc advocates have a darn good point. That makes sense. Richard Schneeman and Nate Berkopec are the kind of folks who would know. It looks like jemalloc gives conservatively an 11% speedup for a big concurrent Rails app. Tcmalloc is more variable but still hits 4%-9% speedup or so, which is nothing to sneeze at. Remember that this is overall speedup - not just when allocating memory, but for the full Rails app's runtime and throughput.

Among other things, this should tell you that heap management is important in Ruby. If you weren't seeing many bytes allocated on the heap, or if heap management was really fast, there wouldn't be a 10% speedup to give!

How Fast is Ruby 2.5.0?

Back in November, I posted speed results for Ruby 2.5.0 preview 1. It was barely faster than Ruby 2.4, which was a bit of a disappointment. However, one very important performance patch landed before it finished, which made a big difference in the final speed.

How big? Let's see, shall we?

Quick Graphs

You just want to see the graphs, I'll bet. I'm the same way. Here's a great start: total-time runs for Rails Ruby Bench. This measures the time taken to push a mixture of Discourse (Rails) requests through a big concurrent server:

Yup, those bars on the right are shorter.

Yup, those bars on the right are shorter.

So: not bad. What's that look like as a table of numbers and percent faster?

PercentileRuby 2.4.3Ruby 2.5.0% Faster
0%29.1726.997.5%
10%32.2530.734.7%
50%33.9832.394.7%
90%35.1533.375.1%
100%36.7735.623.1%

What's interesting here is that the higher (slower) runs gained less speed, which isn't usually how it works. That's almost certainly because of the unusual nature of the performance patch that was nearly all the speed difference: it was a more-or-less constant overhead per Ruby bytecode operation. If the slower runs had instructions that each took longer (pretty likely) then you'd expect them to gain less performance. Which is roughly what you see here.

If we asked, "sure, but what's the overall number? How much faster is Ruby 2.5.0?," I'd probably wind up answering in throughput, not the percentile per-run time. So let's look at throughput:

MeasurementRuby 2.4.3Ruby 2.5.0% Faster
Mean Throughput170.6179.35.1%
Median Throughput171.0179.65.0%

How much faster? 5% faster for throughput on a big concurrent Rails server. Tell your friends!

Can it be faster than that? Sure. With a lot of small, faster operations I was seeing up to 7.5% faster on Rails requests, and Koichi was seeing up to 12% faster on some benchmarks.

But for the simple answer, "will it make my Rails app faster?" Yes. About 5% faster. Which isn't bad for a pretty calm upgrade that isn't likely to break anything. It'll just speed up your code and add a few nice features!

CRuby Memory Slots: See Them, Tweak Them, Make Them Fast

You've probably read a lot about how Ruby handles memory over the years. If you haven't: there's a lot. Ruby is a dynamic language, and managing memory in dynamic languages is complicated. Managing memory well and fast in dynamic languages is usually very complicated. For instance, here's a very simple summary of how garbage collection works in Java. It's similar -- and complex.

Mostly you don't have to care. Most Java developers don't know that whole summary and most Ruby developers understand only a small fraction of how Ruby memory management works. Yay! If you had to know all that to write a program, it would be terrible.

You care about the specifics of how Ruby manages memory if you're optimizing: if you're trying to make your program faster, or have it run in less memory. Let's talk about how Ruby memory works, and how you can tweak it.

We'll talk about the Slots that Ruby uses - what they are, how you check them and how you optimize them.


Ruby Objects: Cheap, Cheaper, Expensive

Ruby has references. And mostly those references point to objects. The Ruby source code calls the references VALUEs, and they need to fit into 64 bits.

Tiny Ruby objects like "nil" and small integers don't get any allocation besides their reference - the number seven, for instance, doesn't get an object allocated to it (sorry, seven!) It gets stored inside the VALUE using bitwise trickery. Ruby doesn't keep an extra copy of seven, or a single frozen copy of seven or something. So tiny objects don't really count in terms of allocated memory or garbage collection. An Array of them can, though -- the Array holds a lot of references (VALUEs.) And while each reference doesn't get a Slot, the Array itself does.

What counts as "tiny?" Integers that Ruby can store in 31 bits or less, between around negative one billion and positive one billion. True, false, undef and nil. Floating point numbers. Symbols. There's a bunch of C code showing how they get encoded into VALUEs.

Every Ruby object that isn't encoded into its VALUE gets a 40-byte "slot". The Ruby structure in the slot is called an RVALUE. Some objects are small enough to fit entirely into a single Slot, such as an Array with up to 3 elements, a smallish Bignum or an Object with only a few instance variables. Ruby says these values are embedded in their RVALUEs if they fit there completely. Since every slot is 40 bytes, Ruby allocates them in big chunks called "pages" for efficiency. So instead of one allocation per Slot, Ruby does one allocation per page of 408 Slots. 408 is how many 40-bytes objects fit into a 16kb memory page after a bit of header overhead.

Objects too big to fit inside a Slot get both a Slot and a chunk of Heap. Heap is "extra" space for bigger Objects. Heap is allocated with normal C malloc unless you build a custom Ruby to do something different. Chunks of Heap take a lot more work to allocate and free. The require more memory and a lot more CPU. A page of Slots still gets allocated via malloc. But it takes one malloc per 408 Slots instead of one malloc per single object. So objects that fit inside a Slot are much cheaper. (Curious about more details? Pat Shaughnessy's Ruby Under a Microscope covers this extensively in chapter 5.)

Here's something interesting: Ruby can't easily reassign a slot. If you use a Slot and later free the object, Ruby waits until all the Slots on that page are free and then frees the page. Ruby doesn't reassign that Slot to a new object, just in case somebody (I'm looking at you, C extensions!) is holding onto a pointer and messes with the new object, thinking it's the old object. Aaron Patterson is trying to fix this, but that's all experimental. Right now, Ruby doesn't free a page unless all the Slots in it are free.


Becoming a Slot Whisperer

Okay, so how do you track Ruby Slots? The first thing you do is call GC.stat. (Disclaimer: GC.stat changes between Ruby versions and depending how you compile your Ruby, so you may see a slightly different set of keys in the hash table!)

If I pop into irb in Ruby 2.3.1, here are the GC stats I see:

hostname:ruby noah.gibbs$ irb
2.3.1 :001 > GC.stat
 => {
   :count=>11,
   :heap_allocated_pages=>132,
   :heap_sorted_length=>133,
   :heap_allocatable_pages=>0,
   :heap_available_slots=>53802,
   :heap_live_slots=>48358,
   :heap_free_slots=>5444,
   :heap_final_slots=>0,
   :heap_marked_slots=>20752,
   :heap_swept_slots=>20813,
   :heap_eden_pages=>119,
   :heap_tomb_pages=>13,
   :total_allocated_pages=>132,
   :total_freed_pages=>0,
   :total_allocated_objects=>184094,
   :total_freed_objects=>135736,
   :malloc_increase_bytes=>13040,
   :malloc_increase_bytes_limit=>16777216,
   :minor_gc_count=>8,
   :major_gc_count=>3,
   :remembered_wb_unprotected_objects=>201,
   :remembered_wb_unprotected_objects_limit=>364,
   :old_objects=>20081,
   :old_objects_limit=>33674,
   :oldmalloc_increase_bytes=>1786560,
   :oldmalloc_increase_bytes_limit=>16777216
 }
2.3.1 :002 >

That's fairly imposing. But you know enough to interpret some of it. Let's talk about that.

"Major GC count" and "minor GC count" are just counting how many times Ruby has garbage collected. These are just how many times they've happened. And "count" is just major plus minor.

"Heap live slots," "heap free slots" and "heap final slots" are about Slots - that's what we're looking for. "Live" slots have objects in them, "free" slots don't, and "final" slots are waiting to be cleaned up and garbage collected.

Pages are also important. "Tomb" pages have no live objects and can be handed back to the operating system. "Eden" pages have live objects. Remember how there are 408 slots per page? We can find out how many of those pages are hanging out in memory.

(Want more detail on all the bits of GC.stat? Here's Nate Berkopec's blog post for that, and you can expect more posts from me as I talk more about Ruby memory.)


The Hideous Secret of Fragmentation

Ruby can't free a page until all the Slots are free. What does it do with a page of 408 Slots when three last Slots never get un-referenced?

Short answer: they stick around forever, if you never unreference those last few.

This results in fragmentation - all your pages have a combination of used and unused slots. If you have a lot of pages with only three real objects each, that results in very bad fragmentation of Slots. You're allocating space for 408 and using 3. Not so good.

The word fragmentation can mean several different things. This "Slot fragmentation" doesn't happen in a language that only uses malloc and free, because there are no Slots. In languages that only use malloc/free there are two kinds of fragmentation. "Internal fragmentation" is extra space added to each block of allocated memory. "External fragmentation" is extra space in between chunks of allocated memory. So: keep in mind that there are at least three different ways to measure fragmentation that might apply to Ruby. "Slot fragmentation" is one.

So how do you measure Slot fragmentation? Like this:

stat = GC.stat
used_ratio = stat[:heap_live_slots].to_f / (stat[:heap_eden_pages] * 408)
fragmentation_ratio = 1.0 - used_ratio

You take the number of eden (live) pages from GC.stat, multiply by 408, and then see how many objects you have inside those pages. You don't expect the fragmentation ratio to be exactly zero - that's only true if you exactly fill every Slot and you happen to have a multiple of 408 objects and no waste at all. But if you see your fragmentation ratio get around 0.2 or 0.3, you're wasting a lot of space - 70%-80% of your total Slots. A freshly-booted irb session has about a 0.006 fragmentation ratio, or a 0.994 "used" ratio.

You also expect the fragmentation to increase over time for a running process, because you'll have the occasional stray page with a few objects you can't free. But if Slot fragmentation keeps increasing, you're probably doing something wrong.

Nate Berkopec says that if your process size goes up asymptotically -- approaches a line, slowly getting nearer and nearer -- then that's fragmentation, and mostly it's fine for a long-running process. But if your process size goes up linearly -- the same amount per hour, every hour -- then that's a memory leak and you need to hunt it down.

Using Your Slot Savvy

Okay, so now you know how to measure fragmentation. What do you do if it's too high?

  • See if you can do your allocations in a big block. Ruby makes it easy to autoload, but it's often better to load everything up front, where all your "keep them forever" classes and data will wind up on the same pages. That can make your fragmentation ratio significantly better.
  • If you have big chunks of data that you allocate on demand, try to do it right at the beginning. Not only will it not wind up in a page of freed data from a later request, it's more likely to wind up on the same pages with your early classes and code from last paragraph.
  • Any time you can avoid keeping a reference around, don't keep it around. The fastest memory management is always no memory management.
  • Do you have a structure that slowly grows or changes? That can be hard. But try to touch it in batches, where lots of allocations will wind up on the same page instead of scattered across many different pages.
  • Do you have a cache that's small and never cleared? If so, maybe you want to make it a permanent allocation up front, or get rid of it entirely.

And finally, don't sweat fragmentation too much. Each page is about 16 kilobytes (technically kibibytes, if you're a pedant.) If you're wasting 100,000 of them, that's worth a look. If you're wasting ten of them... It's 160kb. 

I'll be back next week or so with another lesson about Ruby memory!

How Much Does Meltdown/Spectre Patching Slow Down a Big Rails App?

You've likely heard about the Meltdown and Spectre bugs that affect nearly all modern CPUs. You've probably heard that the patch to fix them costs some performance. You'll hear between a 5% and 20% penalty or more, depending who you ask and about what benchmark.

So how does that affect Rails Ruby Bench, a highly-parallel real-world Rails workload? Ubuntu now provides patches for Meltdown and Spectre (approximately -- see below), so let's find out!

(Why so late? The original coordinated worldwide release date for Meltdown and Spectre was January 9th but Ubuntu took until January 22nd to release full patches for all three CVEs... Which means I heard about them long before I could patch for them, because the Ubuntu patches weren't out yet. D'oh!)

If I ever become a major security vulnerability, I'm gonna hold a small, picturesque stick just like the "Spectre" ghost.

If I ever become a major security vulnerability, I'm gonna hold a small, picturesque stick just like the "Spectre" ghost.

Old and New

On January 22nd Ubuntu got patches out for all three variants of Meltdown and Spectre -- but with several major disclaimers about hypervisors and hardware. And if you check with a Spectre/Meltdown vulnerability checker, it doesn't look like everything is patched yet for yesterday's Ubuntu Xenial AMI, fully patched, on AWS (see the output below.) So there may be a future slowdown when this is fully patched.

I started from my previous AMI configuration with a beta Discourse 1.8.0 version and Ruby 2.3.4 and 2.4.1. We want a nice well-known baseline for checking this. I have lots of numbers for these Discourse and Ruby versions from before the update. And the Spectre and Meltdown slowdowns depend on the workload, but it's going to be very similar for Discourse 1.9 and Ruby 2.5.

Each of these results is based on 20 batches of 6000 requests for each Ruby/Discourse/patchlevel combination. They're all configured with 30 load-tester threads and 10 server processes, each with 6 server threads. It all runs on an AWS m4.2xlarge dedicated instance but it's not doing network I/O. I used 100 warmups for each process before running the 6000 requests. All of this is my normal config for Rails Ruby Bench, and the configuration I always use unless I have a specific reason to diverge from it. In other words if you've been following this blog, it's the same thing you've been seeing.

So let's look at some numbers (at the next section heading.)

meltdown_vuln_checker.png


Graphs and Numbers

I have a lot of results for Rails Ruby Bench from before the patch - the results are pretty stable. But I've included some of them here for your reference -- those are the "pre-patch" numbers. I also took some measurements after the January 9th patch but before the Jan 22nd patch. Those are the "partial patch" numbers, which includes both the Ubuntu Jan 9th patch and the AWS server reboot to patch the hypervisors. And finally there are the "patched" numbers, which includes the Jan 22nd patch and is taken based on the latest Jan 22nd official Ubuntu cloud AMI. Again, there may be later patches -- the vulnerability checker does not think everything is taken care of and the Ubuntu announcement has a lot of disclaimers.

Below, have a quick look at the graphs and optionally the table of results. That's... surprising, at least to me. I am not seeing a 5% to 20% decrease in performance. In fact, while there's a bit of a performance hit from the Jan 9th patch, it seems to have bounced back completely to the original performance with the Jan 22nd patch. These are dedicated AWS instances and not doing network I/O outside the instance, so you shouldn't be seeing noisy neighbor problems -- these numbers have been surprisingly stable month by month, so if there were a 5% drop, you'd definitely expect to see it. These results are so close that there may be no difference, it may be entirely swamped by noise in the measurement.

There's a bit of a drop in the middle, but not much. And the right (patched) results are just as fast as pre-patch.

There's a bit of a drop in the middle, but not much. And the right (patched) results are just as fast as pre-patch.

Ruby VersionPatch StatusThroughput
2.3.4Pre-patch161.8
2.4.1Pre-patch166.4
2.3.4Partial159.8
2.4.1Partial164.6
2.3.4Patched164.5
2.4.1Patched167.0


Conclusions

My guess, based on the data, is that the initial Meltdown and Spectre patches on Jan 9th gave a very small performance penalty, something in the range of 0%-5%, for a large parallel Rails app. But not a lot. It's impossible to tell from this data if that was the Ubuntu patches, the Amazon AWS patches, or both.

But as of Jan 22nd, I am seeing no slowdown whatsoever for concurrent Rails performance with the current Meltdown and Spectre patches. There are reasons to believe that these patches aren't complete (see above.) So it's too early to call it long-term. but I'm not seeing a lot of reason for concern, so far.

Might this be that Rails is I/O-bound? Maybe CPU slowdowns don't matter because Ruby is already so fast that CPU isn't a bottleneck? It's possible, but I don't think so. That same rationale is given every year for why new Ruby changes won't speed up Rails -- Rails does have an I/O-heavy workload, and presumably at some point it will become very hard to optimize it. But Rails on CRuby is still slower than many other web frameworks (e.g. Dropwizard or Torquebox.) And Ruby keeps speeding up Rails every year - with more speedups coming. So I don't think we've hit that point yet, and I definitely don't think a CPU slowdown from Spectre patches would go completely unnoticed.


Quickie: Building Ruby with Memory Profiling

Ruby's garbage collector has some really interesting memory profiling capabilities. If you build with them turned on, they'll be reported as extra entries in GC.stat.

But how do you turn them on? I mean, without downloading the Ruby source code and configuring everything manually...

If you use rvm, it's pretty easy:

cflags="-D RGENGC_PROFILE=2 -DRGENGC_PROFILE_MORE_DETAIL -DRGENGC_PROFILE_DETAIL_MEMORY -DPROFILE_REMEMBERSET_MARK" rvm install --disable-binary --reconfigure 2.4.1-gcprofile

When you use "rvm --disable-binary --reconfigure" you're making sure it rebuilds Ruby even if it could give you an off-the-shelf binary. When you ask for "2.4.1-whatevername" you're saying to install CRuby 2.4.1 with the name you picked -- above, that name is "gcprofile" because I'm turning on GC profiling. So I can "rvm use ruby-2.4.1-gcprofile" to run with it.

All of that other stuff where I'm setting "cflags" to define a whole bunch of C constants? That's what turns on all the GC profiling. If you think that's a fun thing to do, switch to your new GC-profiling-enabled Ruby, pop into irb, and start checking "GC.stat" after various operations.

There are also some fun things you can do with GC::Profiler:

2.4.1-gcprofile :003 > GC::Profiler.methods.sort - Object.methods
 => [:clear, :disable, :enable, :enabled?, :raw_data, :report, :result, :total_time]
2.4.1-gcprofile :004 > GC::Profiler.enabled?
 => false
2.4.1-gcprofile :005 > GC::Profiler.enable
 => nil
2.4.1-gcprofile :006 > 10_000.times { "bob" + "notbob" }
10    1    27    45
1    6    38    38
 => 10000
2.4.1-gcprofile :007 > GC::Profiler.report
GC 14 invokes.
Index    Invoke Time(sec)       Use Size(byte)     Total Size(byte)         Total Object                    GC Time(ms)
    1               0.085               648160              1354560                33864         1.39699999999999535660
    2               0.087                    0                    0                    0         0.27699999999995783551
 => nil
2.4.1-gcprofile :008 > GC::Profiler.disable
 => nil

I hope you'll have a little fun checking it out. I am!

Ruby and Nested Exceptions

Often, one exception causes another.

A library tries to read a configuration file with File.read, which raises an exception of type Errno::ENOENT with the message "No such file or directory @ rb_sysopen". That library then raises another exception to let you know: it couldn't find its configuration, possibly after looking in several different places.

Older versions of Ruby used to throw away this inner exception. The library rescued the "no such file" exception, swallowed it, and raised an entirely new one. Indeed, some libraries still do. Folks like Avdi Grimm and Charles Nutter were in favor of the inner exception sticking around. Ruby isn't the only language to do this. It's common practice in other languages like Java and .NET. You'll even see recommendations for wrapping all exceptions in your library's version, even in Ruby.

And so in recent Ruby, if you raise an exception from the "rescue" block of another, it saves the inner exception. If you rescue the new exception, you can call "cause" on it to find the inner one! (You can also do it differently, but that's documented poorly - I'll show you the secret way to do it if you read all the way to the bottom of this post.)

2.3.1 :003 > begin
2.3.1 :004 >       begin
2.3.1 :005 >           raise "Inner message"
2.3.1 :006?>       rescue
2.3.1 :007?>         raise "Outer message"
2.3.1 :008?>       end
2.3.1 :009?>   rescue
2.3.1 :010?>       nest_e1 = $!
2.3.1 :011?>   end
 => #<RuntimeError: Outer message>
2.3.1 :012 > nest_e1
 => #<RuntimeError: Outer message>
2.3.1 :014 > nest_e1.cause
 => #<RuntimeError: Inner message>

This means that sometimes you can find really interesting information if you look a bit. If the library handles its "no such file or directory" with a rescue and a raise, the error underneath is captured right in the new exception!

Of course, you have to look for it. You don't see the nested exception unless you call "cause" on an exception:

2.3.1 :013 > raise nest_e1
RuntimeError: Outer message
    from (irb):7:in `rescue in irb_binding'
    from (irb):4
    from /Users/noah.gibbs/.rvm/rubies/ruby-2.3.1/bin/irb:11:in `<main>'
2.3.1 :014 > nest_e1.cause
 => #<RuntimeError: Inner message>

But if you can catch the exception and have a look, you can print it out. That's not terrible, but maybe we can do better.

Customizing with Minitest

I use Minitest, and when I get an exception I often want to see what's gone wrong. Even if Ruby's not showing us the problem, maybe we can hook into our test framework?

As it happens, we definitely can!

# test_helper.rb
class Minitest::UnexpectedError
  def message
    # Build a chain of exception causes
    exc = self.exception
    cause_chain = []
    loop do
      cause_chain.push(exc)
      exc = exc.cause
      break unless exc
    end

    bt_lines = cause_chain.map { |c|
      [c.message] + Minitest.filter_backtrace(c.backtrace)
    }.inject() { |acc, bt| acc + ["... Caused By ..."] + bt }
    bt_out = bt_lines.join "\n    "
    return "#{self.exception.class}: #{self.exception.message}\n    #{bt_out}"
  end
end

Note that this technique isn't limited to nested exceptions and causes. An exception object can have anything you want, and you can hook into minitest and print out the extra information. Just generate a string of your choice. You're basically writing a Minitest mini-plugin into your test helper, which is a pretty common thing to do...

For nested exceptions, I've already opened a pull request for Minitest - we'll see if it makes it in!

It looks like the Ruby folks also think we should print the causes for exceptions, but just haven't gotten around to it yet...

Secrets

So if you can set the cause by raising your error from the "rescue" clause, that's okay. But what if you want to do it from somewhere else?

Can you pass the cause to the constructor for your new Exception?

Hm... Not so much, it turns out. There was some debate about it in the bug report, but no.

Instead, there's a secret keyword to "raise" that will let you set a cause if $! isn't set, or override it if it is:

raise MyOuterException.new("oh no!"), cause: MyInnerException.new("ducks!")

Shh... Don't tell anybody. It's a secret. I had to get it out of the Ruby source code and tests, so I assume nobody wants you to know...

Why Do I Care?

Now you know about Ruby's nested exceptions. You care if an exception might have extra information you need for debugging - now you know to catch it and print out the exception's cause... And maybe the cause's cause, and so on.

You care if your test library or REPL is catching and printing an exception but doesn't let you see the cause, like Minitest above. But this same problem applies to RSpec, Test::Unit and even irb or pry - if they're printing the exception but not the cause, you don't get to see it.

And you care if you're writing a gem - be sure to raise your exception from the 'rescue' clause so that folks can see what exception caused the exception! See the Secrets section above, in case your gem's structure is a bit more complicated.


CRuby, MRI, JRuby, RubySpec, Rubinius, YARV: A Little Bit of Ruby Naming

If you've spent a little time in Ruby-land, you have have encountered the names "CRuby" or "MRI". You've almost certainly heard of JRuby, and perhaps a few "other" Rubies like Rubinius, TruffleRuby and maybe even a few "exotic" Rubies like Opal, IronRuby, MacRuby or MagLev.

What are all of these?

CRuby (formerly MRI) Plus YARV

If you're using Ruby then you know about CRuby even if you don't know that name. The default Ruby, the one people think of as "just Ruby," is CRuby. We used to call it MRI for "Matz's Ruby Interpreter." Matz (who wrote Ruby) is a modest guy and Ruby is a team effort, so he has asked us to call it "CRuby." It's a Ruby interpreter written in C, so "CRuby" works. Fair enough.

CRuby's "under the hood" implementation has gone through several generations of technology. "YARV" stands for "Yet Another Ruby VM." YARV is the stack-based interpreter technology that CRuby 1.9 through 2.5 uses. It replaced the old-style "abstract syntax tree" interpreter from Ruby 1.8, long ago. And it looks like YARV may be augmented with a new generation of JIT-based interpreter/compiler technology called MJIT.

Ruby 1.8, YARV and MJIT are all CRuby, but they're different generations of tech within CRuby: the old Ruby 1.8 interpreter, then YARV, then MJIT.

Other Rubies

So if "CRuby" is "Ruby written in C," why do we have to specify? Isn't all Ruby written in C?

Nope.

JRuby is a Ruby interpreter written in Java. It's written and maintained by a different team. It focuses hard on performance - especially for long-running servers like web servers. It's far better for concurrency, especially multithreading. The garbage collection is more advanced, but JRuby uses far more memory and has much longer startup time. Don't write your tiny command-line apps in it! It also takes more warmup to get to full speed. JRuby has great compatibility with Java libraries, but has more trouble with the C libraries CRuby is good with. It's basically a whole different language project that happens to interpret exactly the same source code.

TruffleRuby is like JRuby but even more so - it's written in Java (along with Oracle's compiler-construction kit Truffle and Graal). It focuses hard on the performance of long-running servers. It uses even more memory, takes even longer to get to full speed, but gets even faster once it's fully warmed up. It grew out of JRuby, but is now its own project.

The other major non-CRuby "plain" Ruby is called Rubinius. It started as "Ruby in Ruby" - Ruby with as few C extensions as possible. For that reason, folks like the TruffleRuby team have used its standard library (easier to optimize than a C/Ruby hybrid!) Rubinius used to use an LLVM-based JIT implementation, though that's gone away recently.

There are a few other, mostly older, "alternate" Ruby implementations - OMR on IBM's compiler/interpreter toolkit, IronRuby for Ruby on .NET, MacRuby to run Ruby on the Objective C libraries, Opal for Ruby-transpiled-to-Javascript, MagLev for Ruby on a Smalltalk VM and many others. But JRuby, TruffleRuby and Rubinius are the current big three non-CRuby implementations.

(MacRuby eventually sank, but the code lives on in RubyMotion, a Ruby for writing cross-platform Mac and smartphone apps.)

RubySpec and What Counts as Ruby

How do we know that a different Ruby implementation "really" runs Ruby? What happens if two implementations disagree?

The short answer is: there's a language spec. Not only are there a few formal published industry specs for Ruby, but (more importantly to programmers) there's a *great* set of executable Ruby spec tests called RubySpec, which pretty much every Ruby implementation tests against.

Changes to the Ruby language turn into changes in RubySpec - so it can happen, but there's a central location for it and all the other Ruby implementations see all the changes. Ruby as an implementation-independent language is defined by RubySpec.

Naming

Now you know the names. More importantly, now you know there are more Rubies that do a few different things, and differences between one Ruby and another.

And if you're having any trouble figuring out "is that really Ruby?" you even know the definitive spec for that!


Ruby 3 and JIT: Where, When and How Fast?

You may have heard about Ruby 3 including JIT. Where is JIT coming from? How soon will it be included? How much faster will it be? If I'm worried about debugging with JIT, can I turn it off?

Wait, What's JIT Again?

In case "JIT" isn't a day-to-day word for you: "JIT" is short for "Just-In-Time," or more specifically "Just-In-Time Compiling." Right now, Ruby interprets your program. With JIT, it will convert parts of the Ruby program into machine code, just like a Unix command or an EXE file. Specifically, JIT converts from the kind of Ruby code you read every day into the code that runs most naturally, and fastest, for your processor, often called "machine code" or "machine language."

JIT is different from a "normal" compiler in a few ways. The biggest is that it doesn't compile your whole program. Instead, it compiles just the parts that run the most often, and it compiles them specially to run fastest exactly how your program uses them. It doesn't have to guess how you're calling those methods - it watches your program for awhile and takes notes, then it compiles them.

Alas, JIT removes this excuse. I recommend that you claim you're debugging the AoT settings. Or claim you're running ETL scripts. That works too.

Alas, JIT removes this excuse. I recommend that you claim you're debugging the AoT settings. Or claim you're running ETL scripts. That works too.

How Much Faster?

There are lies, damned lies and benchmarks. I can't give you an exact percentage speedup for JIT or because there is no such percentage. But there are lots of cases where JIT can speed up a particular program by 50%, 150% or 250% on perfectly reasonable workloads. There are even a few realistic workloads where it can speed things up by 500% or more. But of course there are also a few cases where interpreted is faster than JIT, because nothing in the real world is always an optimization.

The current conservative, simple JIT implementations for CRuby add around 30%-50% to performance, or up to 150% depending how you measure. 30%-50% is quite modest for JIT, but these branches are still simple. And 30%-50% is nothing to sneeze at. That's the equivalent of between 3 and 10 years of "normal" release speedups, all in around a year or two of effort to get JIT working. And that's in addition to the usual speedups, which are still happening. And the JIT can keep improving over time. It opens up a whole world of optimization that old-style "only interpreted" Ruby couldn't do, which is why Ruby implementations with JIT can be a lot faster already. Something like TruffleRuby adds a lot of memory overhead, but can speed the code up by 900% or more - CRuby won't match that, but such things are definitely possible.

Usually I answer "how fast?" with numbers from Rails Ruby Bench. That's my thing, after all! But right now, MJIT isn't stable enough to run a big high-concurrency Rails app. Don't worry, I'll publish numbers when it is!

These numbers aren't terribly recent. And the MJIT and YARV-MJIT numbers are still changing too fast to mean much. Soon!

These numbers aren't terribly recent. And the MJIT and YARV-MJIT numbers are still changing too fast to mean much. Soon!

Where Did CRuby JIT Come From?

JIT has been in Ruby in some form for awhile: JRuby has had it for many years. Rubinius had it for awhile and got rid of it. But "plain" CRuby has never had it just built in... yet. Instead, JIT has been around in various experimental branches that never got into a Ruby release.

Shyouhei Urabe's "deoptimization" branch was pretty good, but never quite made it in. It was a very plain, very simple form of JIT that only enabled a few optimizations, but also guaranteed only a tiny bit of extra memory usage. And the Ruby core team really cares about memory usage.

Then recently Vladimir Makarov, the same guy who rebuilt Ruby 2.4 hash tables, wrote a powerful, low-memory JIT implementation called "MJIT". It leverages your existing C compiler (GCC or CLang) for Ruby JIT. MJIT looks amazing - good enough that he was invited to give a RubyKaigi keynote to explain how MJIT works. He first converts Ruby to use a register-based VM instead of stack-based, and then builds JIT on top of that. But MJIT is pretty new and not stable enough for general release to the world. Making a crash-free JIT implementation that can handle any possible Ruby program is hard, and MJIT isn't there yet. Based on recent numbers, though, MJIT can get 230% the speed of Ruby 2.0.0 on CPU benchmarks, so it's clearly doing some things right!

At the same time MJIT was happening, Takashi Kokubun was writing a powerful LLVM-based Ruby JIT implementation called LLRB, inspired by Evan Phoenix's earlier work. Like MJIT, it didn't get polished enough to unleash upon the entire Ruby world. But Takashi went on to take most of MJIT and turn it into... YARV-MJIT.

YARV-MJIT takes MJIT and strips out the changes to make it a register-based VM. Those changes make Ruby faster, but at the cost of more testing to get everything stable. By removing them, we can get a less-capable Ruby JIT, but get it sooner. Remember all those people telling you to make your feature as small as possible and release it sooner? YARV-MJIT is that principle in action: what if we *just* added JIT, even if it's not as much faster? And turn off JIT by default, so we only get this new experimental feature if we request it? But it's the same JIT as in MJIT, just with some of the features turned off.

When Is It Coming?

This is a hard question, of course. It'll depend on what problems get found and how easy they are to fix.

The pull request for YARV-MJIT is open now, so we may be in the countdown until it lands in Ruby... Though it is not in the Ruby 2.5.0 Christmas release, which is for the best.

YARV-MJIT and MJIT are both improving constantly. Vlad thinks MJIT will take around a year to really mature. But YARV-MJIT lets JIT be included with a normal Ruby release without having to be perfect - it'll only be turned on when we ask for it.

So in a narrow sense, it could happen any day now. But it will probably take a year or more before it gets turned on by default. As with immutable strings, Ruby is including more new features as opt-in. This can work a lot like Feature Toggles (aka Feature Flags or Feature Flippers) - you can include the new features before they're fully ready, but make sure they don't conflict with each other. I like this approach a lot more than how the Ruby 1.8/1.9 transition was handled.

From this tweet.

How Will We Know? Can I Turn It Off?

If you're curious when YARV-MJIT makes it into Ruby, I'd recommend following the pull request above.

And if you're worried that JIT might cause you problems (fair,) keep in mind that you can turn it on or off. The RUBYOPT environment variable works for any CRuby, not just the ones with MJIT or YARV-MJIT, and it lets you pass command-line arguments in for every time you run Ruby, not just the one you're typing now.

Right now even in YARV-MJIT, JIT is off by default. If you want to turn it on:

export RUBYOPT="-j"

For YARV-MJIT, you can deactivate JIT by just not passing any JIT parameters. So don't pass anything starting with "-j" and you shouldn't see any JIT happening.

You can also see what JIT does by passing other "-j" parameter. For instance, passing "-j:w" should print any JIT warnings, while "-j:s" should save the .c source files created by JIT in the /tmp directory instead of deleting them.

Want to do more with JIT? I recommend running "ruby --help" with an MJIT or YARV-MJIT enabled Ruby. Here's what that currently prints -- though these options might change before YARV-MJIT is accepted into Ruby, so you should check your local version:

MJIT options:
  s, save-temps   Save MJIT temporary files in /tmp
  c, cc           C compiler to generate native code (gcc, clang, cl)
  w, warnings     Enable printing MJIT warnings
  d, debug        Enable MJIT debugging (very slow)
  v=num, verbose=num
                  Print MJIT logs of level num or less to stderr
  n=num, num-cache=num
                  Maximum number of JIT codes in a cache

How Can I Help? What's Next for JIT in Ruby?

Want to use JIT in Ruby? One of the first, easiest things you can do is to try it out and see if it works!

You can clone and build it like this:

cd ~/my_src_dir
git clone git@github.com:k0kubun/yarv-mjit.git
cd yarv-mjit
autoconf
./configure
make check


Once you've done that, you can test it locally or install it. To test it locally, I like the "runruby" script:

cd ~/my_src_dir/yarv-mjit
./tool/runruby.rb ~/my_src_dir/my_ruby_script.rb

You can also build and mount locally-built Ruby interpreters with rvm:

# be sure to compile it first!
rvm mount ~/my_src_dir/yarv-mjit yarv-mjit
rvm use ext-yarv-mjit

Remember that you can turn on JIT with "-j" and turn on warnings with "-j:w". If you run your code with YARV-MJIT, let us know! I like Twitter for this, personally, but use what works for you.

If you find a problem with JIT, try to cut it down to a small test case for reproduction. Then you can report it on the Ruby bug for YARV-MJIT. Thanks in advance!

How's Progress on Ruby 3x3?

Somebody on Reddit was curious: how are the Ruby folks doing on Ruby 3x3? This answer may be useful to some of you out there as well... (Please note that I don't decide this stuff, but I do keep track of it fairly closely.)

The main announced thrusts of Ruby 3 are performance, concurrency and typing.

For performance, the work is primarily occurring in the normal Ruby trunk. Matz has announced that he wants Ruby 3 to be three times as fast as Ruby 2.0.0, and there has been great progress in that direction.  Rails Ruby Bench is (surprise) a benchmark checking Ruby's performance using a big highly-concurrent Rails app. You can see the results on this engineering blog, thanks to Appfolio, who sponsor my Ruby 3 work. You can also look up optcarrot, which is the other major Ruby 3 benchmark. Mine is Rails-based, while optcarrot is primarily a CPU benchmark. On the Rails-based benchmark, Ruby 2.5.0 head-of-master is around 165% of the speed of Ruby 2.0.0, so progress isn't bad. The optcarrot numbers are also quite good.

In addition to normal "let's make slow things faster" performance work, there are the two JIT branches mentioned below - Takashi and Vlad have been working independently and together, and at this point it looks like Vlad's JIT implementation is likely to make it into Ruby 3 in around a year, if nothing changes (this is not a formal announcement, just a wild prediction, do not take it as guaranteed ;-) )... Though possibly without his changes to convert Ruby's stack-based VM into a register-based VM. The register-based version is faster, but less compatible and would need more stability testing. Takashi's YARV-MJIT branch is just the JIT without the register-based VM changes.

For more Ruby 3 progress, I highly recommend looking up RubyKaigi 2017 videos on YouTube and RubyConf 2017 on ConFreaks. They record all the major Ruby conferences, and a lot of the proposals and status updates have been happening as conference talks. The talks are all available entirely free, though some of the RubyKaigi talks are in Japanese :-(

In particular, Takashi Kokubun gave a *great* YARV-MJIT talk this year at RubyConf, just a few weeks ago. There were several different gradual-typing talks at RubyKaigi and one by Soutaro Matsumoto (no relation) at RubyConf.

Unfortunately, the Guilds-based concurrency stuff isn't in Ruby trunk. There have been a few good blog posts about it (I like this one.) Koichi Sasada, the author of the current Ruby VM, is currently working on it. My understanding is that there's not a current version being shared around. I don't have a good feel for where that's at.

As of RubyKaigi, Matz has said he's not wild about any of the existing gradual-typing proposals, so we're basically at "still figuring out the spec" on Ruby 3 changes to the type system. We've had some on-paper proposals and some early implementations, but nothing is currently close to getting included as a standard part of the language.

And those are the big three, as far as Ruby 3 goes: performance, concurrency, typing. There are some small things "in orbit" around them like static analysis proposals for typing and benchmarking for performance.

But that's basically where things stand.

How Much Faster is Ruby 2.5.0 Preview 1?

Ruby 2.5 is coming! Preview 1 was released. There are a bunch of new features. I'm looking forward to delete_prefix and delete_suffix, myself. There are more articles coming.

And of course, as always, there are performance improvements.

I spend a lot of time benchmarking Ruby. I'm here answering the question, "but how much faster does this make my Rails app?" Clearly it's time for some Ruby 2.5 benchmarking.

What Are We Measuring?

My benchmark Rails Ruby Bench sets up Discourse under a pretty heavy concurrent load of user requests. It determines how fast it can handle them all as it saturates a large, dedicated EC2 instance with requests that need to be handled by Rails (e.g. no static assets.)

Ruby 2.3 and 2.4 were very similar in Rails performance. Ruby 2.5 is very similar to 2.4.1. So when you look at the graphs below, you'll likely have to squint. Also, as always, feel free to ask me for my JSON data from the test runs, and the code is open-source. Very soon it should be automatically running on RubyBench.org, too.

Those bars on the right are all very slightly smaller. That's obvious at first glance, right?

Those bars on the right are all very slightly smaller. That's obvious at first glance, right?

Ruby 2.5.0 is just slightly faster at every request percentile shown above and nearly every percentile, but only very slightly faster. The 100th percentile is literally a single request which, in my tests, just happened to be 4% slower than the equivalent for Ruby 2.4.1 - you can probably ignore it as an outlier.

Here are the same numbers as a table, to three significant digits:

PercentileRuby 2.4.1Ruby 2.5.0% Faster
0%0.005920.005723.5%
1%0.01240.1212.5%
5%0.02050.01983.5%
10%0.02790.02703.3%
50%0.1400.1353.7%
90%0.3770.3721.3%
95%0.4400.4360.9%
99%0.5780.5691.6%
100%1.171.22-4%


And now for some numbers that are too small to really see on graphs... Ruby 2.5.0 has about 1.5% higher throughput overall. That makes sense - a throughput is effectively a mean, and means are easily dominated by a few larger entries, like the higher-percentile table rows above. So you see a throughput that is faster by about the same amount as the 90th percentile, not similar to the median request.

I've run enough trials that I'm convinced it holds up and isn't just statistical noise, but... Yeah. It's very, very similar in speed.

Conclusions

As we move toward Ruby 3x3, it's important to keep watching Ruby's overall speed, and speed specifically when running Rails. Overall, Ruby 2.4.1 is about 150% faster than Ruby 2.0.0 (slides). Not too shabby! But it's not 300% yet, either.

Ruby 2.5.0 preview 1 is another 3% faster on top of the 150%, which helps - they multiply, so you're seeing more like another 4.5% speedup based on the Ruby 2.0.0 baseline. But it's clear that Ruby has squeezed out a lot of the performance gains it can easily get - we're starting to see diminishing returns. Getting another 50% faster is going to be difficult this way, let alone getting to 300%. For that, we're going to need MJIT (Just-In-Time compilation for Ruby) or something like it.

PostScript, added on Dec 4th: it appears that head-of-master Ruby has added another change after preview 1, which adds around 6% speed. So Ruby 2.5 will have around three times the speedup shown in this post. We'll look at that in another post soon. That's around a 10% speedup over Ruby 2.4.1. Not bad at all, but I stand by my conclusion -- it'll take a lot of those to get to 300%. The Ruby 2.5.0 speedup will then be from around 150% of Ruby 2.0.0's speed to around 165% of it. See the future article for more details.


Do Random Seeds Matter?

In working on Rails Ruby Bench, I've explained a bit about how it generates a bunch of fake user actions from a random seed number. Basically, if you choose a particular random seed, you get a different bunch of actions like "post a new comment" or "save a draft" or "view current posts" using the Discourse forum software.

By doing this with a bunch of fake users at once, it (approximately) simulates high load on a busy Rails app.

With a different random seed, you get a slightly different benchmark. I keep posting about how Ruby has gotten faster over time based on my benchmark.

With a different random seed, would I get a different story about that?

Take the Simple Approach

Maybe the answer is as simple as measuring again. I tried out four different random seeds with Ruby 2.3.4 and 2.4.1. Here's what I got:

Primarily this picture says "the author likes pastels."

Primarily this picture says "the author likes pastels."

Okay... So, maybe that doesn't immediately clear it up. It's nice that the random seeds don't change the results much, but it's still not clear what we're looking at. How about a closeup of the same data?

rand_seed_4_runtimes_closeup.png

Hm. Better... maybe?

I like throughputs - the number of requests processed per second over the course of the benchmark. Let's see if those give a clearer answer:

throughput_comparison.png

Really, really, really no.

Bringing Out the Big Guns

It turns out that Ruby 2.3.4 and 2.4.1 are mostly about the same speed. Part of why we're not seeing a lot of difference is that there isn't a lot of difference.

So let's look at more Ruby versions. For this, I needed to use multiple versions of Discourse to get compatibility with Ruby from 2.0.0 to 2.4.1. But when I do...

throughput_with_4_diff_seeds.png

There we go! That's what I was looking for.

Each group shows a specific random seed. Each set of five bars is five different Ruby versions, going from 2.0.0 to 2.1.10 to 2.2.7 to 2.3.4 to 2.4.1. And each set tells the same slightly quirky story (is Ruby getting slower? Not really, but the last two bars are with a different, slower version of Discourse. I did, like, a whole talk that explains it better.)

Would it be easier to see if I sorted by Ruby version? I think it might. Here's what that looks like:

You can see a little noise in the results, but it's basically telling the same story. Again, the Ruby 2.4.1 results are weird because of the Discourse version mismatch.

You can see a little noise in the results, but it's basically telling the same story. Again, the Ruby 2.4.1 results are weird because of the Discourse version mismatch.

Random Seeds Matter, But Not Too Much

If the four random seeds give four slightly-different benchmarks, each of those benchmarks agrees about what Ruby is doing. There's a bit of noise between them -- there should be because they're doing slightly different sets of operations, which take different amounts of time.

Which is perfect - a single benchmark can't perfectly reflect everybody's workload. But if slightly different workloads gave completely different results, something would be very wrong (for instance, I might be measuring wrong, or measuring something chaotic, or not using enough iterations.)

Instead, each workload tells approximately the same story in a slightly different way.

Which is exactly what a seeded, pseudorandom benchmark should do.


Joining Us From RubyKaigi?

At my RubyKaigi talk, I suggested that further information on Ruby performance will be forthcoming here -- and it will.

A gentleman from EngineYard, however, first asked me, "are there any other factors that I wish I had time to cover in my talk and didn't have time?"

OH YES. This is my response to him:


The short answer is "yes, there are a number of factors and I've written blog posts about several of them."

Garbage collection, for instance, is a huge factor. Between Ruby 2.0 and 2.3, the garbage collector changed enormously. And in a high-concurrency, high-memory-usage scenario like mine, it's fair to ask the question, "was the whole difference a matter of garbage collection?" I wrote a blog post about that, doing a fairly quick assessment: "https://appfolio-engineering.squarespace.com/appfolio-engineering/2017/5/12/has-ruby-helped-rails-performance-other-than-garbage-collection"

There's also a lot more to the specifics of how I gathered the data. You can look at the "for pedants only" section at the end of another blog post to see more of the details there: "https://appfolio-engineering.squarespace.com/appfolio-engineering/2017/4/14/comparing-ruby-speed-differences"

As far as Puma and concurrency settings... I tested that fairly extensively and wrote about it: "https://appfolio-engineering.squarespace.com/appfolio-engineering/2017/3/22/rails-benchmarking-puma-and-multiprocess". You won't see a blog post about Puma versus Thin, but it turns out that Puma is *significantly* faster for this benchmark as well. So: there are definitely some interesting things there. I still need to contact Hongli Lai about getting a commercial Passenger license for testing to see how it fares against Puma - there could easily be significant differences there as well.

A few things have changed in my methodology over time, but you can also see how I originally designed the benchmark and why in another blog post, which was critiqued by a number of Ruby performance folks (Nate Berkopec, Charles Nutter and Richard Schneeman, among others.) Here's that post: "https://appfolio-engineering.squarespace.com/appfolio-engineering/2017/1/31/the-benchmark-and-the-rails".

So yeah, there are definitely other factors. I've been working on this a fair bit. And that's ignoring the many and various factors I've explored but I *haven't* found time to blog about. I have a list! For instance: my benchmark allows you to set a random seed. That *should* make essentially no difference in the results if I'm using enough requests. But it's straightforward to actually measure whether it makes a difference, and I haven't yet. I *hope* that won't be worth a blog post, but I haven't actually checked yet...

Also, what if I optimize for latency instead of throughput? Is there a significant difference in request variance between running all requests in a single process versus running in multiple processes (which will be *interesting* to measure for warmup reasons)? I could check startup time with Bootsnap. I could check startup and request time with the enclose.io AoT Ruby compiler.

So yes, there are a number of other interesting factors and things to analyze still, no question. If you watch the AppFolio Engineering blog (linked several times in this message) you'll see these things as they come out. That's where I write up my results!

Thanks for asking! It's wonderful when people are interested in my work :-)

OptCarrot: An Excellent CPU Benchmark for Ruby 3x3

You may have read here about my benchmarking attempts for Ruby 3x3. In addition, there are various small benchmarks in the Ruby source and several other aggregations of benchmarks.

But the other major benchmark currently used for Ruby 3x3 is called OptCarrot. It's written by Yusuke Endoh (aka mametter, aka mame.) It's a very well-designed benchmark. Let's talk a bit about why, shall we?

Anatomy of a Carrot

OptCarrot is a headless hardware emulator for the Nintendo Entertainment System. Everybody should have some fun with profiling, right?

And original NES.&nbsp;most of you are probably too young to remember these.

And original NES. most of you are probably too young to remember these.

It's not actually great for playing games. There are already lots of NES emulators out there. But the idea is cool, and it's obvious to most people what success looks like, which is nice. Here's a NES architecture introduction from the author.

Ruby 2.0 currently runs OptCarrot at 22 frames per second in the benchmarking configuration. So we'd love for Ruby 3.0 to run it at 66 frames per second. That's not as far out of reach as it sounds - Ruby 2.4 is already running at about 30 fps. There are other Ruby implementations running at up to around 200 frames per second, though they need some warmup time for that... So it's not impossible. But even 66 fps probably requires JIT. Several Rubyists are working on it.

You can find more instructions about running the benchmark in OptCarrot's docs.

Benchmark Mode

Since OptCarrot is being used as a benchmark, it normally runs headless. That means it doesn't display the screen, even though it calculates it. That's because showing images changes the timing a lot - waiting for a video card's VRAM or a monitor's vertical sync is important for a good emulator. But it messes up the timing for a benchmark. So optcarrot doesn't use a hardware display. Instead it just calculates everything at full speed, regardless of how fast the frames might be displayed to a real-world player.

OptCarrot is intentionally a CPU benchmark. It doesn't do much I/O. It generates very little garbage in memory, so fast GC doesn't help it. The main loop is simple with no fancy metaprogramming, though it does use send and Method#[].

When OptCarrot is given "--benchmark" it just runs for 180 frames, exits, and prints a checksum of what it calculated. The checksum is important. If you try to patch Ruby to be faster and it breaks OptCarrot, the checksum will change because what's displayed on the screen will change. That's a very intuitive way to verify correctness.

OptCarrot has an optimized mode that you can turn on with --opt. When you use it, it uses a giant case/when statement for all the instructions, a bit like the one inside Ruby's own VM code. That's dirty and ugly, but it's also very fast. Whether you benchmark with or without --opt probably depends on what you're trying to measure... Also, some non-MRI Ruby implementations have a slower case/when statement. Those implementations run much slower with --opt.

With --opt turned on, Ruby 2.0.0 already runs at close to 60fps on a Core i7 4500 with Ubuntu 16.10, and with Ruby 2.4.0 it's close to 80 fps.

Ooh! A Game Console? What Does It Run?

OptCarrot runs a game called "Lan Master" where the player places/rotates connections in a network to try to connect all hosts. You can see an animation of it below.

LanMaster.gif

Ooh! A Benchmark. What Are Its Results?

OptCarrot keeps a nice graph of its results on GitHub. You can see a semi-recent version below.

One thing to keep in mind: it's hard to do this "fairly" when comparing JIT versions, especially with regard to warmup. A JITted implementation like JRuby, TruffleRuby or OMR does best when given a lot of runtime, especially if you throw away times for the first few "warmup" iterations. MRI does best when you time from the very beginning and don't give it too many total iterations -- MRI has amazing startup time, but isn't as fast as JRuby or TruffleRuby for sustained steady-state server performance.

Eventually MRI is likely to add JIT, which is going to give some really interesting results in terms of warmup and runtime...

benchmark-optimized.png

Tooling

One thing I personally love about OptCarrot is that the author clearly understands that even a reproducible, consistent, low-noise benchmark will have some noise in the data from system activity. There's no avoiding it.

And so to deal with that, he includes a simple statistical test to check small differences in the runtime and deal with noise in measurement. If you're measuring very small or very random optimizations, you can run it even more iterations and potentially find even very subtle speedups.

I built a similar statistical profiling tool. I think it's a very useful approach.

I miss PartiallyClips. It's been finished for years now.

I miss PartiallyClips. It's been finished for years now.

So OptCarrot is the Perfect Benchmark?

There is, of course, no such thing as a perfect benchmark. But OptCarrot is a very good benchmark for a specific use case.

In his 2016 RubyKaigi presentation, Matt Gaudet talks about how we should measure "three times faster." Matt works on IBM's Ruby OMR project, so he knows what he's talking about.

One type of benchmark he identifies as needed is a simple CPU benchmark. Other benchmarks that he contrasts it with are numerical/scientific benchmarks, web framework benchmarks and tree modification benchmarks to give the garbage collector a nice workout. I don't think he says so, but I'll say that concurrency benchmarks are also a very good idea. Concurrency is one of Matz's stated goals for Ruby 3x3.

OptCarrot is a very solid, reproducible CPU benchmark with good configuration, tools and testing. It generates very little memory garbage. It runs in a very repeatable way, and it checksums its progress to detect breakages.

In other words, it handles exactly one category from Matt's list, and it does it solidly and simply.

That means it will be a great part of the final suite of Ruby 3x3 benchmarks when the other ones exist. My own benchmark is meant to handle the web framework category, but does so with higher concurrency and less reproducibility -- it's much harder to get good reproducibility for a concurrent benchmark.

OptCarrot is already being used heavily by other Ruby implementations (e.g. TruffleRuby) and Vladimir Makarov's MJIT branch for benchmarking and optimization work. It's helping to determine the optimization of future Ruby. So it's definitely a success in my book.


Rails and Discourse Startup Times

I've spent a lot of time benchmarking how fast Discourse handles HTTP requests with various Ruby versions, to see how much new Ruby fixes help Rails speed. But I haven't looked yet at startup time, which can be very important for Rails apps. Specifically, I'm looking at time to handle first request. It's not the only definition of "startup time," but I think it's a very useful one.

Using a "real world" benchmark with Discourse, a production Rails app, makes for a few challenges. Specifically, Ruby, Rails and Discourse are all independently changing. It's not a synthetic benchmark app, it's a real app with a real user base and it only works with certain specific Ruby versions (and a single Rails version) at any given time.

There are only a few Discourse versions with compatibility from Ruby 2.0.X through 2.3.X. I'm using v1.5.0. Then we'll look at Discourse v1.8.0 (basically up-to-date) for Ruby 2.3.4 and 2.4.0, since current Discourse only supports very recent Ruby.

Older Ruby, Older Discourse

Using Discourse v1.5.0, we see nice clean numbers for startup time - very low variance, very consistent, and speeding up from older Ruby to newer Ruby. As always, feel free to request my JSON data for my results, and the benchmark code is all open.

Discourse startup times get better by increasing Ruby version, and by Discourse version.

Discourse startup times get better by increasing Ruby version, and by Discourse version.

Overall, Discourse 1.5.0 time-to-first request drops from 9.9 seconds with Ruby 2.0.0 to 7.7 seconds with Ruby 2.3.4. That's a 23.3% improvement. Then switching from Discourse 1.5.0 to 1.8.0 on Ruby 2.3.4 improves startup time to 6.5 seconds, or about a 15% speedup from Discourse improvements. And then Ruby 2.4.1 drops startup time to 5.85 seconds, or another 10% speedup.

So overall, Discourse delivers a 15% startup-time speedup from 1.5.0 to 1.8.0, and Ruby delivers a 30% startup-time speedup from 2.0.0 to 2.4.1. Not too shabby!

Future Goodness

None of this takes Bootsnap into account, which apparently drops Discourse startup time by half. Bootsnap is a complex beast, but mostly it works through a combination of caching filesystem checks in the require path and pre-parsing your Ruby code and caching the result.

Bootsnap is scheduled to be standard in every Rails app Gemfile for all new Rails apps, starting some time around Rails 5.0.

So for those following along at home, we expect the 30% Ruby-based startup-time improvement and the 15% Discourse-based startup improvement to be joined by a 50% startup-time improvement in Rails itself. Stay tuned.

Methodology and Picky Details

With only minor tweaks and improvements, this is the same benchmark I've been using for most of my Ruby benchmarking.

The tested Discourse v1.8.0beta13 AMI is public: "ami-f678218d".

The tested Discourse v1.5.0 AMI is also public: "ami-554a4543".

Discourse v1.8.0beta13 was chosen for a combination of Ruby compatibility and benchmark compatibility - there are some changes to Discourse which haven't yet been reflected in Rails Ruby Bench which currently prevent testing with the latest versions. I believe that will be fixed soon, but in the mean time I'm testing with v1.8.0beta13. I have no current reason to believe that this makes a significant difference in speed, or especially in the difference in speed between Ruby 2.3 and 2.4. Should I find problems in the methodology, you should expect them to be published on this blog.

"Time to first request" is measured by dispatching HTTP requests in a tight loop with a short sleep in between. There are a number of interesting variables which could be changed - startup currently is done with many workers and threads, for instance, and it could certainly be faster with fewer of them, though I think it would be less typical of real-world usage. RRB specifically and explicitly aims to be a "production, real-world" benchmark, and so startup time is measured with many threads and workers. The sleep in the loop will eventually be a problem for precision if Rails startup time improves by around 3x-4x. Should that happen, I'll decrease the duration of the sleep or remove it. For now, the sleep is short enough in duration not to cause a precision problem, but long enough to allow the Rails app to handle end-of-request work seamlessly and keep latency low. You can see the measurement logic in start.rb.

Rails' startup time for a large application like Discourse with complex startup logic is not necessarily the same as for a "vanilla" freshly-created Rails app with minimal startup complexity. Indeed, I have seen specific cases where an optimization will improve the "vanilla" startup time while making Discourse startup time worse. My intent is to measure both of those separately so that we can see the impact by Rails version on both. This article only covers the Discourse/complex/production case, not the plain-Rails/vanilla/simple case.


Improving the bundle size of Reactstrap from 295kB to 84kB

At AppFolio we use open source software to build parts of our product. As we spend time fine-tuning the performance of our products, we also end up finding possible improvements in the open source packages that we use. By contributing the improvements back to the projects, we are able to have others in the open source community benefit from the work that we do, everybody profits.

In this post I’ll focus on one of such contributions: the migration of Reactstrap from using Webpack 1 to using Rollup. Reactstrap is an implementation of the Bootstrap 4 components in React.

The migration of Reactstrap from Webpack 1 to Rollup has two major effects: it reduces the bundle size of the library significantly and allows for publishing a distribution that preserves ES2015 "import" and "export" statements. The module-based version is great for applications that depend on Reactstrap because it enables tree-shaking. Tree-shaking is a feature of Rollup and of Webpack 2+ that removes unused dependencies from your bundle. So if you use 3 components from Reactstrap, you will only ship 3 components to your users instead of all 72 components.

There are two ways to consume Reactstrap: You either import it in your JavaScript code or you reference Reactstrap directly from your HTML page. After analyzing the builds, we noticed issues with both ways.

Bundling for CommonJS

Reactstrap is shipped as ES5-compatible JavaScript but is written in a more modern version of JavaScript. It uses Babel to transpile the source code to be ES5-compatible.

The “main” entry in your package.json file defines the entry point of your module. The entry point is loaded when a user depends on your package.

For a release, Reactstrap would transpile the source code file for file into ES5-compatible code, without bundling them into a single file. For example, the component "src/Button.js" will now be available in ES5 as "lib/Button.js". No bundler would be involved. It then set the entry point to "lib/index.js" and left the bundling up to whatever the consumer of Reactstrap wanted to do.

This approach comes with a big cost for the file size. Because files are transpiled one file at a time, Babel will include helper functions to support new JavaScript functionality in each file. Since "lib/index.js" imports all dependencies, you will end up with the helpers being included once per component!

As a lot of the non-interactive components in Reactstrap are very small, it could add as much as 35% to the file size to individual components. Take for example "lib/CardDeck.js", it’s 1.62kB. The helpers here include "_extends", "_interopRequireDefault" and "_objectWithoutProperties". They add up together to 577 bytes of the overall size of the file.

The first step in solving this is to set the entry point of Reactstrap to point at a bundled version of the source code. This bundle still depends on the same dependencies but now has been transformed by Rollup into a single flat file. This is the same approach that gave React 16 a 10% reduction in bundle size and a 9% boost in startup speed. (source)

The next step is to configure our bundler to handle the helpers correctly. For this we can use the external helpers Babel plugin to prevent the helpers from being added to each file. The Babel plugin for Rollup will take care of injecting the helpers as a single block at the top of the bundle.

A nice touch by Rich Harris is that the Babel plugin for Rollup will warn you if you forget to use the external helpers Babel plugin.

Since Reactstrap currently contains 72 components, we have just saved around 36kB by deduplicating the helpers and have improved performance by shipping a flat bundle.

The UMD build

Reactstrap also includes a UMD build for consumers that reference the code directly via a script tag from their HTML page. The UMD build of Reactstrap 4.3.0 is 295kB. That’s big!

If we sum up all the unminified transpiled component sizes, we get to 213kB. So how is it possible that a minified and bundled version is even bigger than that?

To dig into this, we use a tool called source-map-explorer. This tool will allow you to inspect any JavaScript file with associated source map and see the contribution of each source file to the size. It shows as a treemap visualization so the bigger the rectangle, the more space it takes up.

Treemap visualization of the Reactstrap 4.3.0 UMD bundle - interactive HTML page

By looking at the generated treemap, the cause of the file size is easy to spot: both React and React DOM are included, contributing 140kB to the file size. Both React and React DOM are marked as external in the Reactstrap Webpack configuration but it looks like it was slightly misconfigured, causing both React and React DOM to be bundled inside Reactstrap too!

We corrected this in the Rollup config, saving another 140kB.

Bonus: Replacing big dependencies

While observing the source map, we also noticed that the package lodash.omit takes up 9.29kB. That’s a lot of space for a utility function. It looks like the unminified lodash.omit v3 was 2.31kB but it jumped to 37.76kB in lodash.omit v4. After looking at how it was used inside Reactstrap, we were able to write our own function that minifies to just 105 bytes, saving another 9kB.

On a side note, we also experimented with trying to import the lodash functions directly from the lodash package and have tree-shaking remove the ones we don’t use. This did not reduce the bundle size (PR). This is due to Rollup having to be conservative in which parts of code it removes (see Rollup wiki for more info).

Conclusion

Configuring your bundler is easy to get wrong. An incorrectly configured bundler might be difficult to spot because your tests can still pass and your users can still be happy.

In the case of Reactstrap, once correctly configured, we managed to reduce the bundle size from 295kB to 84kB. That being said, the biggest benefit for most people will actually be the module based build which will allow them to cherry-pick only the components they need into their own bundle!

Note: if you are the author of a JavaScript library and are using Webpack, consider migrating to Rollup to allow module-based builds (blog post by the authors of Webpack and Rollup). A good starting point will be the Reactstrap rollup config.

Thanks to Chris LaRose, Gary Thomas and Damon Valenzona for giving feedback on the article.
 

A Story of Passion and Hash Tables

Ruby 2.4.0 introduced a lot of great new features. One of them was open addressing for hash tables - the details of open addressing are a bit obscure, but Ruby hash tables are now faster. Everybody uses hash tables, so everybody gets extra speed. Awesome!

But how did that happen? There's an interesting story there. Let's tell that story and benchmark with Rails Ruby Bench, shall we? (Don't care about the story? Scroll down to the end for graphs of the speed differences.)

A Beginning and Some Dueling Banjos

Ruby's open addressing for hash tables is recorded by a truly wonderful bug report. If you don't care about my commentary, just go read it. Seriously.

It begins with Vladimir Makarov proposing open addressing for Ruby's hash tables and including a patch. Open addressing is a better match for modern multilevel CPU caches than Ruby's previous method. That was very nice of him. Thank you, Vladimir! (Here's his explanation of the hash table changes.)

Is that the end of the story? Not so much.

Koichi points out that his very first patch wasn't perfect, and increased memory usage in some cases (true.) Nobu and Yura Sokolov (funny_falcon) point out some other minor problems. Feedback happens, especially with a large patch, or one that touches very common functionality like hash tables.

Vladimir responded, more back-and-forth ensued, and funny_falcon continued to engage more and talk about how he'd have done it (he didn't think open addressing was necessary, for instance, and that he could get similar results without it.) Vladimir responded to him. There was a highly-technical argument, mostly good-natured, going strong. And eventually less good-natured. It's easy for tempers to run hot in technical discussions -- I do the same thing, and they clearly understood what was going on. Isn't it wonderful to watch engineers doing what they feel passionate about, showing that they care but also acknowledging that we all want the same thing? I love watching that.

If you have time, read through the whole thread. The back-and-forth is wonderful, and highly educational -- "you should use quadratic probing," "here's the wikipedia article for...," "I disagree that this should be int32," "test large inserts, does the time grow linearly?" It's not just a great deep dive into hash tables. It's a great study in passionate disagreement between highly skilled engineers.

It also involved Vladimir and Yura proposing and counter-proposing patches with different good and bad points, back and forth, and critiquing each other's code constantly. Who had the better hash table implementation?

Eventually Shyouhei and Koichi (prominent core Ruby committers) looked over the results and checked for errors. The patches continued to improve, and the edge cases kept getting fixed. Either Yura's or Vladimir's patch might win. Each had taken tricks from the other.

Nearly-final patches were prepared. Decisions were made about features like maximum hash size. Evaluations continued and intensified. Fixes were made. Yura's patch eventually adopted open addressing, and the two patches were very similar...

Koichi put together some great benchmarks and a wonderfully comprehensive report - and basically said the implementations were so close you could pick between them with a coin toss.

Speed versus table size of different hash tables, from Koichi's report.

Speed versus table size of different hash tables, from Koichi's report.

And even then, the patches and improvements didn't stop. Not from either of the participants.

And in the end, as the deadline loomed, Vladimir's version was chosen. There was a graceful acknowledgement by Vladimir, a touch of grumbling by funny_falcon and then a graceful concession -- after putting months into his own version, I'm impressed and grateful that Yura conceded. It's a very hard thing to do. And Ruby hash tables came out much better for the competition. He did us all a great service.

And it appears that Vladimir enjoyed his time modifying Ruby - he's recently put together a whole new Ruby VM, still in early development, that significantly improves overall speed! Unfortunately, it's not ready to run Rails yet so I can't measure it with Rails Ruby Bench. Soon, perhaps?

How To Measure?

I thought, "I'll check how much faster the patch is using my Discourse-based Ruby benchmark!" Koichi, like the built-in Discourse benchmarks, tends to microbenchmark by testing the same URLs many times, while my benchmark tries to simulate a realistic, varied, highly-concurrent workload.

Trying out my benchmark for this, I discovered... Oh, right. Discourse isn't compatible with that range of prerelease 2.4.0-series Rubies. Oops.

Soon I realized: I can patch the latest prerelease Ruby to remove open-addressing hash tables and go back to the old closed-addressing code. Then I can check the two against each other!

Of course, it's never quite that easy. The hash table code has changed a few more times since then. But eventually it worked nicely. You can see the code I used here. So: the comparison below isn't pre-2.4.0 before and after the hash patch. Instead, it's current prerelease Ruby, and that same Ruby plus a patch to use old-style closed addressing hash tables again. That patch is the only code difference between the two Rubies.

It works, though! As before, this benchmark uses a multithreaded load-test program, a vigorously multiprocess and multithreaded Puma and Discourse, running flat-out on an EC2 m4.2xlarge dedicated instance.

I've doubled the number of HTTP requests per run from 1500 to 3000. With newer Ruby and Rails versions, the benchmark runs quite quickly, and some randomness and slowdowns that were "in the noise" are now big enough to see in my graphs. Running more requests is giving me more predictable results in return for a bit more CPU time.

How Fast?

Like my previous articles, I used a mixed grouping of Discourse HTTP requests. The per-request speedup is subtle enough to be hard to see:

Yes, all the right-hand bars are a little lower at every percentile. No, not much lower. so: new-style hash tables improve each request, but not by a huge amount.

Yes, all the right-hand bars are a little lower at every percentile. No, not much lower. so: new-style hash tables improve each request, but not by a huge amount.

I can see the difference in the full thread runtimes better. Perhaps you can too:

This is how long it takes for 100 consecutive requests. The per-request speedup adds up. These are the shortest, median and longest times to process 100 requests during a benchmark run. Left side are old-style closed addressing hash results, right a…

This is how long it takes for 100 consecutive requests. The per-request speedup adds up. These are the shortest, median and longest times to process 100 requests during a benchmark run. Left side are old-style closed addressing hash results, right are open-addressing.

The median request with closed addressing (old-style) hash tables takes 0.134 seconds, and the 90th percentile takes 0.371 seconds (see below.) With open addressing, that's 0.127 median and 0.355 for the 90th percentile. In both cases, that's about a 5% speedup -- not for just the hash operations, but for the entire Rails request time. That's not bad.

The median run with closed addressing hash tables takes 17.312 seconds, and the 90th percentile takes 17.95 seconds. With open addressing it's 16.577 median and 17.417 for the 90th percentile. That's also around 5% speedup, give or take.

MetricClosedOpen
Median Req0.1340.127
90th Pct Req0.3710.355
Median Full Run17.31216.577
90th Pct Full Run17.95017.417

(As always, feel free to request my JSON data files, or to spin up an m4.2xlarge dedicated instance with the benchmark code and try for yourself.)

Conclusions

I started investigating this because I wanted to make sure my benchmark worked and made sense when checking out new Ruby optimizations. So I tried out the Ruby 2.4.0 hash table changes - a case where they really cared about the answer, "does this make a difference for Rails applications?" The short answer is "yes -- these hash table changes speed up a real Rails app by about 5% overall." Which is pretty serious!

The bug report and its story are, of course, a whole saga unto themselves.

Thanks for reading!

How is Ruby Different in Japan?

I've had a few conversations recently where I say things like, "the Japanese Ruby community uses Ruby for different things than in America"... and I get blank stares. Specifically, I mention that America is very centered on Rails and web apps with Ruby. No surprise, right?

"But then," people ask, "if they're not using Ruby for Rails, what do they do with it?"

And why does anybody care? For the same reason I have these conversations. Because the American style of Rails usage lends itself to throwing huge amounts of memory and concurrency at your problems, and the Japanese style of Ruby usage does not. This normally comes up when they ask, "but why can't Ruby just use JIT?" JIT is complex and memory-intensive. It's great for running a web server. It sucks for... Well, let's look at what the Japanese folks do, shall we?

(The wonderful Twitter exchange in response to this post also examines what's up with MRI and JIT. If you're here for the JIT, it's worth a read.)

The Photogenic Zachary Scott and a billboard for "Ruby City Matsue" in Shimane Prefecture, Japan

The Photogenic Zachary Scott and a billboard for "Ruby City Matsue" in Shimane Prefecture, Japan

A Difference in Community

The American Ruby community mostly happened because of Rails. Yes, yes, Ruby had a long and storied history before Rails happened (and yes, it did.) But America finally noticed Ruby because of Rails.

As a result, Ruby's fortunes in America have looked a lot like how Rails is currently doing. Rails rose and Ruby rose. Rails has mostly peaked and is decreasing, and so is Ruby. It's not that Ruby is only used for Rails -- it isn't. But the two have risen and fallen together in the United States, and in most of the English-speaking world.

Japan has looked a little different. Not only was Ruby popular long before Rails came along, Rails wasn't the sort of wildfire in Japan that it had been in America. And now that the tides of Rails are receding and you're seeing fewer American regional Ruby conferences...

Japan has them all over the place, and only increasing in number. Ruby-no-Kai is Japan's version of Ruby Central, and is hosting six or more regional RubyKaigi (Ruby conferences) this year -- just in Japan! Some of the conferences are new, some have met for the last few years, up to 11 years (!) for the older ones. And of course, there's the worldwide RubyKaigi. There is also an enterprise conference, Ruby World. And multiple award conferences: RubyBiz and the Fukuoka Ruby Awards, plus a Ruby Prize at Ruby World. Ruby is still very much growing in Japan. As a fun little aside: Ruby-no-Kai tracks their conferences with a bug tracker. So you can see them there.

Another difference: government sponsorship. Japan is very proud that Ruby was invented in Japan and is still based there. FCOCA, part of Fukuoka Prefecture, sponsored multiple American Ruby tours and a bunch of embedded Ruby work, and a variety of Ruby-based contests and awards. Shimane sponsors Ruby work as well, and has Matsue ("The Ruby City".) There are areas that used to be miniature Silicon Valleys of their own, and their local government is trying to get over that hump with... Ruby. Often, but not always, embedded Ruby and Ruby IoT devices.

That's one reason you see a lot of Japanese government sponsorship for mruby. American audiences often ask, "why would you want an embedded Ruby?" But for the Japanese, it's a lot of how they were already using Ruby. Ruby has great memory usage and embeds pretty well. mruby embeds really well. But embedded Ruby and mruby aren't a big part of the English-speaking Ruby world.

One other major difference in the Japanese Ruby community is how centralized it is. Many of the core contributors like Koichi Sasada, Shyouhei Urabe, Yui Naruse, Zachary Scott and Akira Matsuda live within 10-15 minutes of each other and talk often. Matz, of course, talks to them all regularly, including at regular committer meetings. Their regional conferences are run primarily by one organization, and their sponsorship comes primarily from a few specific sources.

One more point that affects how the core Ruby committers view Ruby technically: Matz is employed full-time by Heroku, and Koichi (author of the current Ruby VM, Director of the Ruby Association) was until recently. Heroku is an American company, owned by SalesForce. But it's also a hosting company, and so its views on memory usage (its biggest expense) versus CPU (often idle, easy to 'move' between VMs) is rather different than an American company hosting Rails on raw EC2 instances. They also really want Ruby to behave well on the smallest Heroku instances, for all sorts of good reasons.

A Japanese Enterprise Ruby Conference

For some other differences, let's look at the program for Ruby World 2016, which happened in Matsue, Shimane, Japan.

The first Ruby World talk was about using Ruby for an in-car electrical control unit testing machine. The second talk was about using embedded mruby to develop applications for embedded hardware. So yes, there's that embedded thing...

The third talk is about Enechange, an electricity price comparison service. That one would have a web site, but it's still not what you'd think of as a typical U.S. Ruby-based startup.

Next is sponsor talks from Hitachi, and from Eiwa System Management. Based on their company page, which mentions "in-vehicle system development of automobiles," I'd guess there is some embedded Ruby-in-cars going on there too.

The following two talks are about Scientific Computing, followed by machine learning infrastructures. Both are useful, and both happen in the English-speaking Ruby world as well, but I see them more from the Japanese Ruby community. On the "Japanese data management" front, Treasure Data is also worth a mention. They're also a significant force in the Japanese Ruby community, and they also employ prominent Ruby folks.

The next Ruby World talk, on learning mruby with Lego MindStorms does sound like something you'd see at an English-language Ruby convention, but it's also embedded. And after a "scaling the company with Ruby" talk from R-learning, an "IT services and support" company, is one called "Tried to start programming class for children in a small town," which again sounds like something you'd see at a Ruby convention in California or New York.

A lot of the other talks are also about the business or practice of development rather than applications of Ruby -- for instance about Agile, DevOps and how to get a job as a developer. And after a sponsor talk from an IoT sensor company focused on sake brewing, there's a sponsor talk from a Rails consultancy. So it's certainly not as if America and Japan use Ruby totally differently.

Same and Different, Different and Same

You'll see some Ruby on Rails in the Japanese community, it's true. But you'll also find that they often use it a bit differently -- like CookPad, which proudly runs the world's largest Rails monolith, basically by using Rails as a CMS. It's conceptually more like WordPress than it is like Twitter.

The Ruby Association, from Google's Street view

The Ruby Association, from Google's Street view

And of course, the English-speaking Ruby world isn't all Rails. You'll find some machine learning and IoT in American Ruby conferences. Presumably Ruby is even running in a car somewhere in America as well. There are definitely liaisons between the Ruby and Rails worlds, like Aaron Patterson, Akira Matsuda and Richard Schneeman. But the overall focus is different.

So: the next time you think, "why isn't Ruby perfectly optimized for Rails and Rails alone?" it's worth remembering the Japanese folks. That's where Ruby comes from. It's where most of the Ruby development happens. And it's a different world, doing different things. There's some Rails, yes. But Rails is a long way from being their whole world.

Many thanks to Zachary Scott, who knows far more about the Japanese Ruby community than I do. He read drafts of this article, suggested many new angles, and helped me see where I'd made some significant mistakes. A lot of the "Difference in Community" section is information he graciously pointed out and I hadn't known.

And many thanks to Matz for Ruby, for mruby, and for corrections to this article about mruby and Heroku!

Rails Speed with Ruby 2.4.0 and Current Discourse

My recent benchmarking blog posts looked at how Rails and Discourse performance changed from Ruby 2.0.X to 2.3.X But they have a glaring, huge omission: they stop at Ruby 2.3.4 and at Discourse 1.5.0 (vintage March 2016.) That covers a lot of the post-Ruby-2.0 performance improvements, but what's changed between 2.3.4 and the latest Ruby?

Unfortunately, the Discourse version we used, 1.5.0, doesn't support Ruby 2.4 or higher. It's a risk with using a real app for benchmarking. New Discourse only supports Ruby 2.3 or 2.4. So: let's look at current Discourse's speed on Ruby 2.3.4 and Ruby's head-of-master in Git.

Runs

As you may remember from previous posts, Rails Ruby Bench runs a series of consecutive requests about as fast as Puma can manage on an EC2 m4.2xlarge dedicated instance. So let's look at comparative times for full runs between Ruby 2.3.4 and 2.5.0 (head-of-master.)

I'm seeing roughly 10%-15% lower time-per-run between runs. from Ruby 2.0.0 to 2.3.4 was about A 30% speedup, so an extra 10% or 15% on top of that isn't bad.

I'm seeing roughly 10%-15% lower time-per-run between runs. from Ruby 2.0.0 to 2.3.4 was about A 30% speedup, so an extra 10% or 15% on top of that isn't bad.

You can also visualize these results as the total change in throughput -- that's the number of requests/second until the slowest load thread finishes, so it emphasizes the longest-running requests:

This is also around 10% to 15% speedup. It's based on exactly the same numbers, so that's no surprise.

This is also around 10% to 15% speedup. It's based on exactly the same numbers, so that's no surprise.


And finally, let's look at individual request times. You may recall from previous comparisons that different Ruby versions have different effects on the fastest and slowest requests -- so let's compare 2.3.4 to 2.5.0 by various request speeds...

As with earlier transitions, everything slow speeds up. You can't see sub-median requests here, but 1) they're very fast and 2) they speed up, but only a little. Ruby 2.3.4 is on the left, ruby head-of-master is on the right.

As with earlier transitions, everything slow speeds up. You can't see sub-median requests here, but 1) they're very fast and 2) they speed up, but only a little. Ruby 2.3.4 is on the left, ruby head-of-master is on the right.

As with earlier posts, this shows that Ruby head-of-master is incrementally speeding up nearly everything. Unlike some of the earlier Ruby versions, slower requests did not get disproportionate improvement here. Even the very fast requests (e.g. 5th percentile) sped up a tiny bit. One thing you can read into that: it's not primarily about the garbage collector speeding up, or about a few unusual slow operations. Most of Ruby has increased in speed by a small percentage, pretty uniformly.

Conclusions

With support for Ruby 2.4.0 and higher, this brings Rails Ruby Bench support to the present day. It also allows us to check for whether particular optimizations help Rails speed with a real application. Look for more of that in the future.

And as far as Ruby 2.4, if you're not using it, you're missing out on about 10%-15% extra speed in Rails. And if you're using Ruby before 2.3.4, you're missing even more speed!

If you hear somebody say "yeah, but these optimizations don't affect I/O-bound applications like most Rails apps," you now have a comprehensive answer: Ruby 2.0 to 2.4 has decreased request times for Rails by around 40% combined, and even more for slower requests. And by all indications, more speed is coming in the future.

Methodology and Footnotes

For the last post, I switched from using a t2.2xlarge EC2 instance to an m4.2xlarge instance. The latter is slightly slower but supports dedicated placement so that I don't have to worry about noisy neighbors (aka other VMs on the same hardware, affecting my benchmark speed.) I expect to stay with the m4.2xlarge for the foreseeable future. If you see modest differences in the specific number of requests per second or increases in the milliseconds per request, that's probably why. This shouldn't change the relative speed of different Ruby versions significantly, it's just a small multiplier on the graph scale.

Last post and this post both use dedicated EC2 instances instead of shared. Thus, the change to m4.2xlarge.

As always, my benchmark code is on GitHub, and the Ruby and Discourse code are standard and open-source. You can contact me for any of my benchmark JSON files. Data processing is done via process.rb in the benchmark repository. Graph output is now via Rickshaw. I don't put full source for graphs in the repository since it's repetitive and a little tedious - contact me if you want it. You can find an example Rickshaw output template in the graph directory of the repository. All Rickshaw output is based on variations of that template.