How MJIT Generates C From Ruby - A Deep Dive

You probably already know the basics of JIT in Ruby. CRuby’s JIT implementation, called MJIT, is a really interesting beast.

But what does the C code actually look like? How is it generated? What are all the specifics?

If you’re afraid of looking at C code, this may be a good week to skip this blog. I’m just sayin’.

How Ruby Runs Your Code

I’ll give you the short version here: Ruby parses your code. It turns it into an Abstract Syntax Tree, which is just a tree-data-structure version of the operations you asked it to do. Before Ruby 1.9, Ruby would directly interpret the tree structure to run your code. Current Ruby (1.9 through 2.6-ish) translates it into buffers of bytecodes. These buffers are called ISEQs, for “Instruction SEQuences.” There are various tools like yomikomu that will let you dump, load and generally examine ISEQs. BootSnap, the now-standard tool to optimize startup for large Rails apps, works partly by loading dumped ISEQs instead of parsing all your code from .rb files.

Also, have I talked up Pat Shaughnessy’s Ruby Under a Microscope lately? He explains all of this in massive detail. If you’re a Ruby-internals geek (guilty!) this is an amazing book. It’s also surprising how little Ruby’s internals have changed since he wrote it.

In the Ruby source code, there’s a file full of definitions for all the instructions that go into ISEQs. You can look up trivial examples like the optimized plus operator and see how they work. Ruby actually doesn’t call these directly - the source file is written in a weird, not-exactly-C syntax that gets taken apart and used in multiple ways. You can think of it as a C DSL if you like. For the “normal” Ruby interpreter, they all wind up in a giant loop which looks up the next operation in the ISEQ, runs the appropriate instructions for it and then loops again to look up the next instruction (and so on.)

A Ruby build script generates the interpreter’s giant loop as a C source file when you build Ruby. It winds up built into your normal ruby binary.

Ruby’s MJIT uses the same file of definitions to generate C code from Ruby. MJIT can take an ISEQ and generate all the lines of C it would run in that loop without actually needing the loop or the instruction lookup. If you’re a compiler geek, yeah, this is a bit like loop unrolling since we already know the instruction sequence that the loop would be operating on. So we can just “spell out” the loop explicitly. That also lets the C compiler see where operations would be useless or cancel each other out and just skip them. That’s hard to do in an interpreter!

So what does all this actually look like when Ruby does it?

MJIT Options and Seeing Inside

It turns out that MJIT has some options that let us see behind the curtain. If you have Ruby 2.6 or higher then you have JIT available. Run “ruby —help” and you can see MJIT’s extra options on the command line. Here’s what I see in 2.6.2 (note that some options are changing for not-yet-released 2.7):

JIT options (experimental):
  --jit-warnings  Enable printing JIT warnings
  --jit-debug     Enable JIT debugging (very slow)
  --jit-wait      Wait until JIT compilation is finished everytime (for testing)
  --jit-save-temps
                  Save JIT temporary files in $TMP or /tmp (for testing)
  --jit-verbose=num
                  Print JIT logs of level num or less to stderr (default: 0)
  --jit-max-cache=num
                  Max number of methods to be JIT-ed in a cache (default: 1000)
  --jit-min-calls=num
                  Number of calls to trigger JIT (for testing, default: 5)

Most of these aren’t a big deal. Debugging and warnings can be useful, but they’re not thrilling. But “—jit-save-temps” there may look intriguing to you… I know it did to me!

That will actually save the C source files that Ruby is using and we can see inside them!

If you do this, you may want to set the environment variables TMP or TMPDIR to a directory where you want them - OS X often puts temp files in weird places. I added an extra print statement to mjit_worker.c in the function “convert_unit_to_func” right after “sprint_uniq_filename” so that I could see when it created a new file… But that means messing around in your Ruby source, so you do you.

Multiplication and Combinatorics

# multiply.rb
def multiply(a, b)
  a * b
end

1_000_000.times do
  multiply(7.0, 10.0)
end

I decided to start with really simple Ruby code. MJIT will only JIT a method, so you need a method. And then you need to call it, preferably a lot of times. So the code on the right is what I came up with. It is intentionally not complicated.

The “multiply” method multies two numbers and does nothing else. It gets JITted because it’s called many, many times. I ran this code with “ruby —jit —jit-save-temps multiply.rb”, which worked fine for me once I figured out where MacOS was putting its temp files.

The resulting .c file generated by Ruby is 236 lines. Whether you find this astoundingly big or pretty darn small depends a lot on your background. Let me show you a few of the highlights from that file.

Here is a (very) cut-down and modified version:

// Generated by MJIT from multiply.rb
ALWAYS_INLINE(static VALUE _mjit_inlined_6(...));
static inline VALUE
_mjit_inlined_6(rb_execution_context_t *ec, rb_control_frame_t *reg_cfp, const VALUE orig_self, const rb_iseq_t *original_iseq)
{
    // ...
}

VALUE
_mjit0(...)
{
    // ...
    label_6: /* opt_send_without_block */
    {
        // ...
        stack[0] = _mjit_inlined_6(ec, reg_cfp, orig_self, original_iseq);
    }
}

What I’m showing here is that there is an inlined _mjit_inlined_6 method (C calls them “functions”) that gets called by a top-level “mjit0” method, which is the MJIT-ted version of the “multiply” method in Ruby. “Inlined” means the C compiler effectively rewrites the code so that it’s not a called method - instead, the whole method’s code, all of it, gets pasted in where the method would have been called. It’s a bit faster than a normal function call. It also lets the compiler optimize it just for that one case, since the pasted-in code won’t be called by anything else. It’s pasted in at that one single call site.

If you look at the full code, you’ll also see that each method is full of “labels” and comments like the one above (“opt_send_without_block”). Below is basically all of the code to that inlined function. If you ignore the dubious indentation (generated code is generated), you have a chunk of C for each bytecode instruction and some setup, cleanup and stack-handling in between. The large “cancel” block at the end is all the error handling that is done if the method does not succeed.

The chunks of code at each label, by the way, are what the interpreter loop would normally do.

And if you examine these specific opcodes, you’ll discover that this is taking two local variables and multiplying them - this is the actual multiply method from the Ruby code above.

static inline VALUE
_mjit_inlined_6(rb_execution_context_t *ec, rb_control_frame_t *reg_cfp, const VALUE orig_self, const rb_iseq_t *orig
inal_iseq)
{
    const VALUE *orig_pc = reg_cfp->pc;
    const VALUE *orig_sp = reg_cfp->sp;
    VALUE stack[2];
    static const VALUE *const original_body_iseq = (VALUE *)0x7ff4cd51a080;

label_0: /* getlocal_WC_0 */
{
    MAYBE_UNUSED(VALUE) val;
    MAYBE_UNUSED(lindex_t) idx;
    MAYBE_UNUSED(rb_num_t) level;
    level = 0;
    idx = (lindex_t)0x4;
    {
        val = *(vm_get_ep(GET_EP(), level) - idx);
        RB_DEBUG_COUNTER_INC(lvar_get);
        (void)RB_DEBUG_COUNTER_INC_IF(lvar_get_dynamic, level > 0);
    }
    stack[0] = val;
}

label_2: /* getlocal_WC_0 */
{
    MAYBE_UNUSED(VALUE) val;
    MAYBE_UNUSED(lindex_t) idx;
    MAYBE_UNUSED(rb_num_t) level;
    level = 0;
    idx = (lindex_t)0x3;
    {
        val = *(vm_get_ep(GET_EP(), level) - idx);
        RB_DEBUG_COUNTER_INC(lvar_get);
        (void)RB_DEBUG_COUNTER_INC_IF(lvar_get_dynamic, level > 0);
    }
    stack[1] = val;
}

label_4: /* opt_mult */
{
    MAYBE_UNUSED(CALL_CACHE) cc;
    MAYBE_UNUSED(CALL_INFO) ci;
    MAYBE_UNUSED(VALUE) obj, recv, val;
    ci = (CALL_INFO)0x7ff4cd52b400;
    cc = (CALL_CACHE)0x7ff4cd5192e0;
    recv = stack[0];
    obj = stack[1];
    {
        val = vm_opt_mult(recv, obj);

        if (val == Qundef) {
            reg_cfp->sp = vm_base_ptr(reg_cfp) + 2;
            reg_cfp->pc = original_body_iseq + 4;
            RB_DEBUG_COUNTER_INC(mjit_cancel_opt_insn);
            goto cancel;
        }
    }
    stack[0] = val;
}

label_7: /* leave */
    return stack[0];

cancel:
    RB_DEBUG_COUNTER_INC(mjit_cancel);
    rb_mjit_iseq_compile_info(original_iseq->body)->disable_inlining = true;
    rb_mjit_recompile_iseq(original_iseq);
    const VALUE current_pc = reg_cfp->pc;
    const VALUE current_sp = reg_cfp->sp;
    reg_cfp->pc = orig_pc;
    reg_cfp->sp = orig_sp;

    struct rb_calling_info calling;
    calling.block_handler = VM_BLOCK_HANDLER_NONE;
    calling.argc = 2;
    calling.recv = reg_cfp->self;
    reg_cfp->self = orig_self;
    vm_call_iseq_setup_normal(ec, reg_cfp, &calling, (const rb_callable_method_entry_t *)0x7ff4cd930958, 0, 2, 2);

    reg_cfp = ec->cfp;
    reg_cfp->pc = current_pc;
    reg_cfp->sp = current_sp;
    *(vm_base_ptr(reg_cfp) + 0) = stack[0];
    *(vm_base_ptr(reg_cfp) + 1) = stack[1];
    return vm_exec(ec, ec->cfp);

} /* end of _mjit_inlined_6 */

The labels mark where a particular bytecode instruction in the ISEQ starts, and the name is the name of that bytecode instruction. This is doing nearly exactly what the Ruby interpreter would, including lots of Ruby bookkeeping for things like call stacks.

What Changes?

Okay. We’ve multiplied two numbers together. This is a single, small operation.

What changes if we do more?

Well… This is already a fairly long blog post. But first, I’ll link a repository of the output I got when multiplying more than two numbers.

And then after you clone that repo, you can start doing interesting things yourself to see what changes over time. For instance:

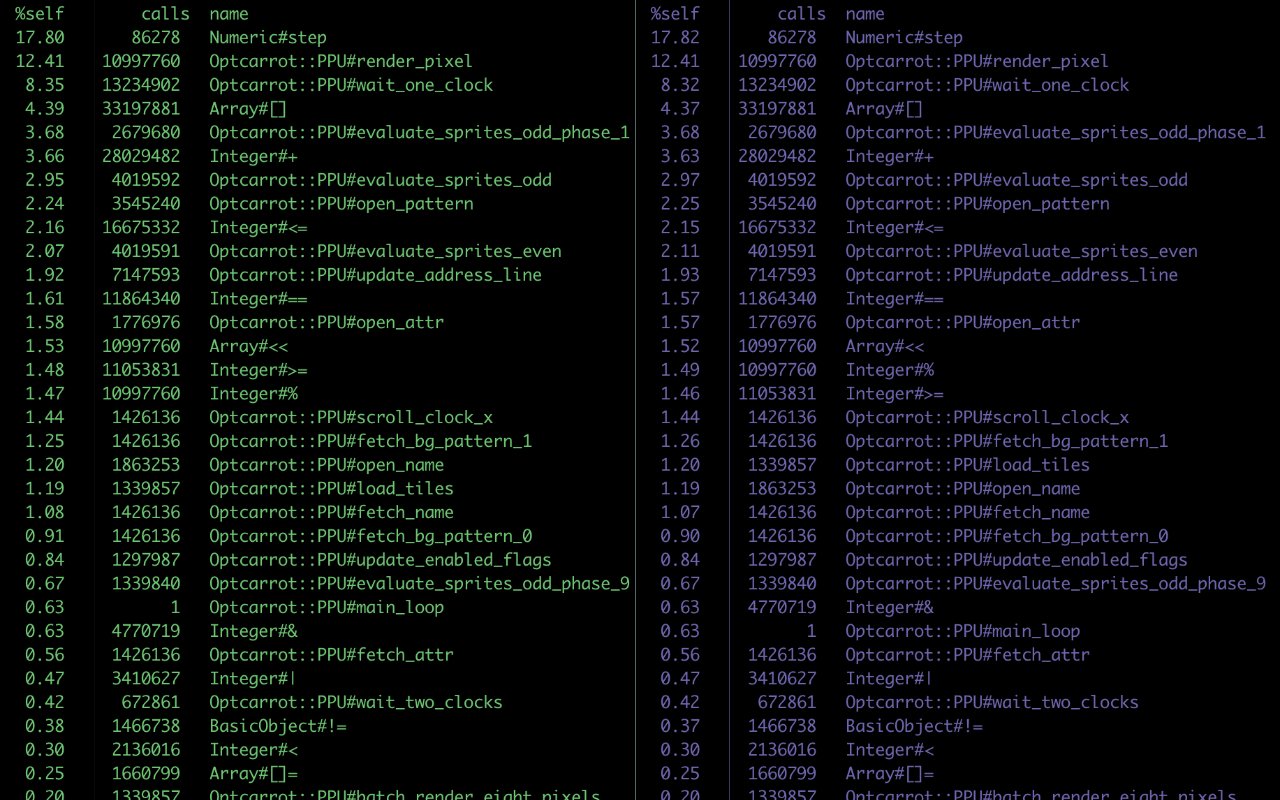
# See what's different between multiplying 2 Floats and multiplying 3 Floats
diff -c multiply_2_version_0.c multiply_3_version_0.c

And in fact, if we multiply three or more Floats, MJIT will realize it can improve some things over time. When multiplying three (or four!) Floats, it will produce three different chunks of C code, not just one, as it continues to iterate. So:

# See what's different between the first and second way to multiply three Floats
diff -c multiply_3_version_0.c multiply_3_version_1.c

I’ll let you have a look. When looking at diffs, keep in mind that the big hexadecimal numbers in the CALL_INFO and CALL_CACHE lines will change for every run, both in my output and in any output you make for yourself — they’re literally hardcoded memory addresses in Ruby, so they’re different for every run. But the other changes are often interesting and substantive, as MJIT figures out how to optimize things.

What Did We Learn?

I like to give you interesting insights, not just raw code dumps. So what’s interesting here?

Here’s one interesting thing: you don’t see any checks for whether operations like multiply are redefined. But that’s not because of excellent JIT optimization - it’s because that all lives inside the vm_opt_mult function call up above. At best, they might be recognized as a repeat check and the compiler might be able to tell that it doesn’t need to check them again. But that’s actually hard — there’s a lot of code here, and it’s hard to verify that none of it could possibly ever redefine an operation… Especially in Ruby!

So: MJIT is going to have a lot of trouble skipping those checks, given the way it structures this code.

And if it can’t skip those checks, it’s going to have a lot of trouble doing optimisations like constant folding, where it multiplies two numbers at compile time instead of every time through the loop. You and I both know that 7 * 10 will always be 70, every time through the loop because nobody is redefining Integer multiply halfway. But MJIT can’t really know that - what if there was a trace_func that redefined operations constantly? Or a background thread that redefined the operation halfway through? Ruby allows it!

To put it another way, MJIT isn’t doing a lot of interesting language-level optimisation here. Mostly it’s just optimising simple bookkeeping like the call stack and C-level function calls. Most of the Ruby operations, including overhead like checking if you redefined a function, stay basically the same.

That should make sense. Remember how MJIT got written and merged in record time? It’s very hard to make language-level optimizations without a chance of breaking something. MJIT tries not to change the language semantics at all. So it doesn’t make many changes or assumptions. So mostly, MJIT is a simple mechanical transform of what the interpreter was already doing.

If you didn’t already know what the Ruby interpreter was doing under the hood, this is also a fun look into that.

Benchmark Results: Threads, Processes and Fibers

You may recall me writing an I/O-heavy test for threads, processes and fibers to benchmark their performance. I then ran it a few times on my Mac laptop, wrote the numbers down and called it a day.

While that can be useful, it’s now how we usually do benchmarking around here. So let’s do something with a touch more rigor, shall we?

Also some pretty graphs. I like graphs.

Methodology

If you’re the type to care about methodology (I am!) then this is a great time to review the previous blog post and/or the code to the tests.

I’ve written a simple master/worker pattern in (separately) threads, fibers and processes. In each case, the master writes to the worker, which reads, writes a response, and waits for the next write. This is very simple, but heavy on I/O and coordination.

For this post, I’ll be timing the results for not just threads vs fibers vs processes, but also for Rubies 2.0 through 2.6 - specifically, CRuby versions 2.0.0-p0, 2.1.10, 2.2.10, 2.3.8, 2.4.5, 2.5.3 and 2.6.2.

I’ll mention “workers” for all these tests. For thread-based testing, a “worker” is a thread. Same for processes and fibers - one worker is one process or one fiber.

First Off, Which is Faster?

It’s hard to definitively say which of the three methods of concurrency is faster in general. In fact, it’s nearly a meaningless question since they do significantly different things and are often combined with each other.

t_v_f_v_p_ruby_2_6.png

Now, with sanity out of the way, let’s pretend we can just answer that with a benchmark. You know you want to.

The result for Ruby 2.6 is to the right.

It looks as if processes are always faster assuming you don’t use too many of them.

And that’s true, sort of. Specifically, it’s true until you start to hit limits on memory or number of processes, and then it’s false. That’s probably why you’re seeing that rapid rise in processing time for 1,000 processes. These are extremely simple processes - if you’re doing more real work you wouldn’t use 1,000 workers because you’d run out of memory long before that.

However, for a simple task like this, fibers beat threads because they’re lighter-weight, using less memory or CPU. And processes beat both, because they get around Ruby’s use of the GIL, and it’s such a tiny task that we don’t hit memory constraints until we use close to 1,000 processes - a far larger number of workers than is useful or productive.

tfp_ruby_20.png

In fact, you would normally use multiple of these. You can and should use multiple threads or fibers per process with multiple processes in CRuby to avoid GIL issues. Yeah, fine, real-world issues. Let’s ignore them and have more fun with graphs. Graphs are awesome.

You might (and should) reasonably ask, "but is this an artifact of Ruby 2.6?” To the right are the results for Ruby 2.0, for reference. They do not include 1,000 workers because Ruby 2.0 segfaults when you try that.

Processes Across the Years

forks_by_ruby.png

How has our Ruby multiprocess performance changed since Ruby 2.0? That’s the baseline for Ruby 3x3, so it can be our baseline here, too.

If you look to the right, the short answer is that if you use a reasonable number of workers the performance is excellent and very stable. If you use a completely over-the-top number of workers, the performance isn’t amazing. I wouldn’t really call that a bug.

Incidentally, that isn’t just noisy data. While I only ran each test 10 times, the variance is very low on the results. Ruby 2.3.8 and 2.6.2 just seem to be (reliably) extra-bad with far too many processes. Of course, that’s a bad idea on any Ruby, not just the extra-bad versions.

In general, though, Ruby processes are living up to their reputation here - CRuby has used processes for concurrency first and foremost. Their performance is excellent and so is their stability.

Though you’ll notice that the “1,000 processes” line doesn’t go all the way back to Ruby 2.0.0-p0, as mentioned above. That’s because it gets a segmentation fault and crashes the Ruby interpreter. That’s a theme - fibers and threads also crash Ruby 2.0.0-p0 when you try to use far too many of them. But Ruby 2.1 has fixed the problem. I hope that doesn’t mean you need to upgrade, since Ruby 2.1 is almost six years old now…

Threads Across the Years

threads_by_ruby.png

That was processes. What about threads?

They’re pretty good too. And unlike processes, thread performance has improved pretty substantially between Ruby 2.0 and 2.6. That’s nearly twice as fast for an all-coordination, all-I/O task like this one!

1,000 threads is still far too many for this task, but CRuby handles it gracefully with only a slight performance degradation. It’s a minor tuning error, not a horrible misuse of resources like 1,000 processes would be.

What you’re seeing there, with 5-10 threads being optimal for an I/O-heavy workload, is pretty typical of CRuby. It’s hard to get great performance with a lot of threads because the GIL keeps more than one from running Ruby at once. Normally with 1,000 threads, CRuby’s performance will fall off a cliff - it simply won’t speed up beyond something like 6 threads. But this task is nearly all I/O, and so the GIL does fairly minimal harm here.

Fibers Across the Years

fibers_by_ruby.png

Fibers are the really interesting case here. We know they’ve received some rewriting love in recent Ruby versions, and I’ve seen Fiber.yield times significantly improved from very old to very new CRuby. Their graph is to the right. And it is indeed interesting.

First, 1,000 fibers are clearly too many for this task, as with threads and processes. In fact, threads seem to handle the excess workers better, at least until 2.6.

Also, fibers seem to get worse for performance after 2.0 until 2.6 precipitously fixes them. Perhaps that’s Samuel Williams’ work?

It’s also fair to point out that I only test fibers (or threads or processes, for that matter) with a pure-Ruby reactor. All of this assumes that a simple IO.select is adequate, when you can get better performance using something like nio4r to use more interesting system calls, and to do more of the work in optimized C.

Addendum: Ruby 2.7

I did a bit of extra benchmarking of (not yet released) Ruby 2.7, with the September 6th head-of-master commit. The short version is that threads and processes are exactly the same speed as 2.6 (makes sense), while fibers have gained a bit more than 6% speed from 2.6.

So there’s more speed coming for fibers!

Conclusions

Clearly, the conclusion is to only use processes in CRuby, ever, and to max out at 10 processes. Thank you for coming to my TED talk.

No, not really.

Some things you’re seeing here:

  • Fibers got faster in Ruby 2.6 specifically. If you use them, consider upgrading to Ruby 2.6+.

  • Be careful tuning your number of threads and processes. You’ve seen me say that before, and it’s still true.

  • Threads, oddly, have gained a bit of performance in recent CRuby versions. That’s unexpected and welcome.

Thank you and good night.

Benchmarking Fibers, Threads and Processes

Awhile back, I set out to look at Fiber performance and how it's improved in recent Ruby versions. After all, concurrency is one of the three pillars of Ruby 3x3! Also, there have been some major speedups in Ruby's Fiber class by Samuel Williams.

It's not hard to write a microbenchmark for something like Fiber.yield. But it's harder, and more interesting, to write a benchmark that's useful and representative.

Wait, Wait, Wait - What?

And don’t get me started on parallelism…

And don’t get me started on parallelism…

Okay, first a quick summary: what are fibers?

You know how you can fork a process or create a thread and suddenly there’s this code that’s also running, alongside your code? I mean, sure, it doesn’t necessarily literally run at the same time. But there’s another flow of control and sometimes it’s running. This is all called concurrency by developers who are picky about vocabulary.

A fiber is like that. However, when you have multiple fibers running, they don’t automatically switch from one to the other. Instead, when one fiber calls Fiber.yield, Ruby will switch to another fiber. As long as all the fibers call yield regularly, they all get a chance to run and the result is very efficient.

Fibers, like threads, all run inside your process. By comparison, if you call “fork” for a new process then of course it isn’t in the same process. Just as a process can contain multiple threads, a thread can contain multiple fibers. For instance, you could write an application with ten processes, each with eight threads, and each of those threads could have six fibers.

A thread is lighter-weight than a process, and multiple can run inside a process. A fiber is lighter-weight than a thread, and multiple can run inside a thread. And unlike threads or processes, fibers have to manually switch back and forth by calling “yield.” But in return, they get lower memory usage and lower processor overhead than threads in many cases.

Make sense?

We’ll also be talking about the Global Interpreter Lock, or GIL, which these days is more properly called the Global VM Lock or GVL - but nobody does, so I’m calling it the GIL here. Basically, multiple Ruby threads or fibers inside a single process can only have one of them running Ruby at once. That can make a huge difference in performance. We’re not going to go deeply into the GIL here, but you may want to research it further if this topic interests you.

Why Not App Servers?

It’s a nice logo, isn’t it?

It’s a nice logo, isn’t it?

Some of you are thinking, "but comparing threads and fibers isn’t hard at all." After all, I do lots of HTTP benchmarking here. Why not just benchmark Puma, which uses threads, versus Falcon, which uses fibers, and call it a day?

Several reasons.

One: there are a lot of differences between Falcon and Puma. HTTP parsing, handling of multiple processes, how the reactor is written. And in fact, both of them spend a lot of time in non-Ruby code via nio4r, which lets Ruby use some (very cool, very efficient) C libraries to do the heavy lifting. That's great, and I think it's a wonderful choice... But it's not really benchmarking Ruby, is it?

No, we need something much simpler to look at raw fiber performance.

Also, Ruby 3x3 uses Ruby 2.0 as its baseline. Falcon, nio4r and recent Puma all very reasonably require more recent Ruby than that. Whatever benchmark I use, I want to be able to compare all the way back to Ruby 2.0. Puma 2.11 can do that, but no version of Falcon can.

Some Approaches that Didn't Work

Just interested in the punchline? Skip this section. Curious about the methodology? Keep reading.

I tried putting together a really simple HTTP client and server. The client was initially wrk while the server was actually three different servers - one threads, one processes, one fibers. I got it partly working.

But it all failed. Badly.

Specifically, wrk is intentionally picky and finicky. If the server closes the socket on it too soon, it gives an error. Lots of errors. Read errors and write errors both, depending. Just writing an HTTP server with Ruby's TCPSocket is harder than it looks, basically, if I want a picky client to treat it as reasonable. Curl thinks it's fine. Wrk wants clean benchmark results, and says no.

If I avoid strategy and vision, I can narrow the scope of my failures. That’s the right takeaway, I’m sure of it.

If I avoid strategy and vision, I can narrow the scope of my failures. That’s the right takeaway, I’m sure of it.

Yeah, okay, fine. I guess I do want clean benchmark results. Maybe.

Okay, so then, maybe just a TCP socket server? Raw, fast C client, three different TCPServer-based servers, one threads, one processes, one fibers? It took some doing, but I did all that.

That also failed.

Specifically, I got it all working with threads - they're often the easiest. And a 10,000-request run took anything from 3 seconds to 30 seconds. That... seems like a lot. I thought, okay, maybe threads are bad at this, and I tried it with fibers. Same problem.

So I tried it with straight-line non-concurrent code for the server. Same problem. What about a simple select-based reactor for the fiber version to see if some concurrency helps? Nope. Same problem.

It turns out that just opening a TCP/IP socket, even on localhost, adds a huge amount of variation to the time for the trial. So much variation that it swamps what I'm trying to measure. I could have just run many, many trials to (mostly) average out the noise. But having more measurement noise than signal to measure is a really bad idea.

So: back to the drawing board.

No HTTP. No TCP. No big complicated app servers, so I couldn't go more complicated.

What was next?

Less Complicated

I’m starting to enjoy how tremendously bad the visual explanations of shell pipes are. Maybe that’s a form of Stockholm Syndrome?

I’m starting to enjoy how tremendously bad the visual explanations of shell pipes are. Maybe that’s a form of Stockholm Syndrome?

What's more predictable and less variable than TCP/IP sockets? Local process-to-process sockets with no network protocol in the middle. In Ruby, one easy way to do that is IO.pipe.

You can put together a pretty nice simple master/worker pattern by having the master set up a bunch of workers, each with a shell-like pipe. It's very fast to set up and very fast to use. This is the same way that shells like bash sets up pipe operators for "cat myfile | sort | uniq" to run output through several programs before it's done.

So that's what I did. I used threads as workers for the first version. The code for that is pretty simple.

Basically:

  • Set up read and write pipes

  • Set up threads as workers, ready to read and write

  • Start the master/controller code in Ruby’s main process and thread

  • Keep running until finished, then clean up

There’s some brief reactor code for master to make sure it only reads and writes to pipes that are currently ready. But it’s very short, certainly under ten lines of “extra.”

The multiprocess version is barely different - it's so similar that there are about fives lines of difference between them.

And Now, Fibers

The fiber version is a little more involved. Let's talk about that.

Threads and processes both have pre-emptive multitasking. So if you set one of them running and mostly forget about it, roughly the right thing happens. Your master and your workers will trade off pretty nicely between them. Not everything works perfectly all the time, but things basically tend to work out okay.

In cooperative multitasking, he keeps the goofy grin on his face and switches when he feels like. In preemptive multitasking he can’t spend too long on the cellphone or the hand with the book slaps him.

In cooperative multitasking, he keeps the goofy grin on his face and switches when he feels like. In preemptive multitasking he can’t spend too long on the cellphone or the hand with the book slaps him.

Fibers are different. A fiber has to manually yield control when it's done. If a fiber just reads or writes at the wrong time, it can block your whole program until it’s done. That's not as severe a problem with IO.pipe as with TCP/IP. But it's still a good idea to use a pattern called a reactor to make sure you're only reading when there's data available and only writing when there's space in the pipe for it.

Samuel Williams has a presentation about Ruby fibers that I used heavily as a source for this post. He includes a simple reactor pattern for fibers there that I'll use to sort my workers out. Like the master in the earlier code, this reactor uses IO.select to figure out when to read and write and how to transfer control between the different fibers. The reactor pattern can be used for threads or processes as well, but Samuel's code is written for fibers.

So initially, I put all the workers into a reactor in one thread, and the master with an IO.select reactor in another thread. That's very similar to how the thread and process code is set up, so it's clearly comparable. But as it turned out, the performance for that version isn't great.

But it seems silly to say it's testing fibers while using threads to switch back and forth... So I wrote a "remastered" version of the code, with the master code using a fiber per worker. Would this be really slow since I was doubling the number of fibers...? Not so much.

In fact, using just fibers and a single reactor doubled the speed for large numbers of messages.

And with that, I had some nice comparable thread, process and fiber code that's nearly all I/O.

How’s It Perform?

I put it through its paces locally on my Macbook Pro with Ruby 2.6.2. Take this as “vaguely suggestive” performance, in other words, not “heavily vetted” performance. But I think it gives a reasonable start. I’ll be validating on larger Linux EC2 instances before you know it - we’ve met me before.

Here are numbers of workers and requests along with the type of worker, and how long it takes to process that number of requests:

ThreadsProcessesFibers w/ old-style MasterFibers w/ Fast Master
5 workers w/ 20,000 reqs each2.60.714.21.9
10 workers w/ 10,000 reqs each2.50.674.01.7
100 workers w/ 1,000 reqs each2.50.763.91.6
1000 workers w/ 100 reqs each2.82.55.02.4
 
10 workers w/ 100,000 reqs each255.84116

Some quick notes: Processes give an amazing showing, partly because they have no GIL. Threads beat out Fibers with a threaded master, so combining threads and fibers too closely seems to be dubious. But with a proper fiber-based master they’re faster than threads, as you’d hope and expect.

You may also notice that processes do not scale gracefully to 1000 workers, while threads and fibers do much better at that. That’s normal and expected, but it’s nice to see the data bear it out.

That final row has 10 times as many total requests as all the other rows. So that’s why its numbers are about ten times higher.

A Strong Baseline for Performance

This guy has just gotten Ruby Fiber code to work. You can tell by the posture.

This guy has just gotten Ruby Fiber code to work. You can tell by the posture.

This article is definitely long enough, so I won't be testing this from Ruby version 2.0 to 2.7... Yet. You can expect it soon, though!

We want to show that fiber performance has improved over time - and we'd like to see if threads or processes have changed much. So we'll test over those Ruby versions.

We also want to compare threads, processes and fibers at different levels of concurrency. This isn't a perfectly fair test. There's no such thing! But it can still teach us something useful.

And we'd also like a baseline to start looking at various "autofiber" proposals - variations on fibers that automatically yield when doing I/O so that you don't need the extra reactor wrapping for reads and writes. That simplifies the code substantially, giving something much more like the thread or process code. There are at least two autofiber proposals, one by Eric Wong and one by Samuel Williams.

Don't expect all of that for the same blog post, of course. But the background work we just did sets the stage for all of it.

How Ruby Encodes References - Ruby Tiny Objects Explained

When you’re using Ruby and you care about performance, you’ll hear a specific recommendation: “use small, fast objects.” As a variation on this, people will suggest you use symbols (“they’re faster than strings!”), prefer nil to the empty string and a few similar recommendations.

It’s usually passed around as hearsay and black magic, and often the recommendations are somehow wrong. For instance, some folks used to say “don’t use symbols! They can’t be garbage collected!”. But nope, now they can be. And the strings versus symbols story gets a lot more complicated if you use frozen strings…

I’ve explained how Ruby allocates tiny, small and large objects before, but this will be a deep dive into tiny (reference) objects and how they work. That will help you understand the current situation and what’s likely to change in the future.

We’ll also talk a bit about how C stores objects. CRuby (aka Matz’s Ruby or “plain” Ruby) is written in C, and uses C data structures to store your Ruby objects.

And along the way you’ll pick up a common-in-C trick that can both be used in Ruby (Matz does!) and help you understand the deeper binary underpinnings of a lot of higher-level languages.

How Ruby Stores Objects

You may recall that Ruby has three different objects sizes, which I’ll call “tiny,” “small” and “large.” For deeper details on that, the slides from my 2018 RubyKaigi talk are pretty good (or: video link.)

But the short version for Ruby on 64-bit architectures (such as any modern processor) is:

  • A Ruby 8-byte “reference” encodes tiny objects directly inside it, or points to…

  • A 40-byte RVALUE structure, which can fully contain a small object or the starting 40 bytes of…

  • A Large object (anything bigger), which uses an RVALUE and an allocation from the OS.

Make sense? Any Ruby value gets a reference, even the smallest ones. Tiny values are encoded directly into the 8-byte reference. Small or large objects (but not tiny) also get a 40-byte RVALUE. Small objects are encoded directly into the 40-bytes RVALUE. And large objects don’t fit in just a reference or just an RVALUE, so they get an extra allocation of whatever size they actually need (plus the RVALUE and the reference.) For the C folks in the audience, that “extra allocation” is the same thing as a call to malloc(), the usual C memory allocation function.

The RVALUE is often called a “Slot” when you’re talking about Ruby memory. Technically Ruby uses the word “slot” for the allocation and “RVALUE” for the data type of the structure that goes in a slot, but you’ll see both words used both ways - treat them as the same thing.

Why the three-level system? Because it gets more expensive in performance as the objects get bigger. 8-byte references are tiny and very cheap. Slots get allocated in blocks of 408 at a time and aren’t that big, so they’re fairly cheap - but a thousand or more of them start to get expensive. And a large object takes a reference and a slot and a whole allocation of its own that gets separate tracked - not cheap.

So: let’s look at references. Those are the 8-byte tiny values.

Which Values are Tiny?

I say that “some” objects are encoded into the reference. Which ones?

  • Fixnums between about negative one billion and one billion

  • Symbols

  • Floating-point numbers (like 3.7 or -421.74)

  • The special values true, false, undef and nil

That’s a pretty specific set. Why?

C: Mindset, Hallucinations and One Weird Trick That Will Shock You

C really treats all data as a chunk of bits with a length. There are all sorts of operations that act on chunks of bits, of course, and some of those operations might be assigned something resembling a “type” by a biased human observer. But C is a big fan of the idea that if you have a chunk of bytes and you want to treat it as a string in one line and an integer the next, that’s fine. Length is the major limitation, and even length is surprisingly flexible if you’re careful and/or you don’t mind the occasional buffer overrun.

What’s a pointer? Pointers are how C tracks memory. If you imagine numbering all the bytes of memory starting at zero, and the next byte is one, the next byte two and so on, you get exactly how old processors addressed memory. Some very simple embedded processors still do it that way. That’s exactly what a C pointer is - an index for a location in memory, if you were to treat all of memory as one giant vector of bytes. Memory addressing is more complicated in newer processors, OSes and languages, but they still present your program with that same old abstraction. In C, you use it very directly.

So when I say that in C a pointer is a memory address, you might ask, “is that a separate type from integer with a bunch of separate operations you can do on it?” and I might answer “it’s C, so I just mean there are a bunch of pointer operations that you can do with any piece of data anywhere inside your process.” The theme here is “C doesn’t track your stuff for you at runtime, who do you think C is, your mother?” The other, related theme is “C assumes when you tell it something you know what you’re doing, whether you actually do or not.” And if not, eh, crashes happen.

One bit related to this mindset: allocating a new “object” (really a chunk of bytes) in C is simple: you call a function and you get back a pointer to a chunk of bytes, guaranteed to hold at least the size you asked for. Ask it for 137 bytes, get back a pointer to a buffer that is at least 137 bytes big. That’s what “malloc” does. When you’re done with the buffer you call “free” to give it back, after which it may become invalid or be handed back to somebody else, or split up and parts of it handed back to somebody else. Data made of bits is weird.

A side effect of all of this “made of bits” and “track it yourself” stuff is that often you’ll do type tagging. You keep one piece of data that says what type another piece of data is, and then you interpret the second one completely differently depending on the first one. Wait, what? Okay, so, an example: if you know you could have an integer or a string, you keep a tag, which is either 0 for integer or 1 for string. When you read the object, first you check the tag for how to interpret the second chunk of bits. When you set a new value (which could be either integer or string) you also set the tag to the correct value. Does this all sound disorganized and error-prone? Good, you’re understanding a bit of what C is like.

One last oddity: because of how processor alignment and memory tracking works, due to a weird quirk of history, pointers are essentially always even. In fact, values returned by a memory allocator on a modern processor is always a multiple of 8, because most processors don’t like accessing an 8-bytes value on an address that isn’t a multiple of 8. The memory allocator can’t just tell you not to use any 8-byte values. Processors are weird, yo.

Which means if you looked at the representation of your pointer in binary, the smallest three bits would always be zero. Because, y’know, multiple of 8. Which means you could use those three bits for something. Keep that in mind for the next bit.

Okay, So What Does Ruby Do?

If this sounds like I’m building up to explaining some type-tagging… Yup, well spotted!

It turns out that a reference is normally a C pointer under the hood. Basically every dynamic language does this, with different little variations. So all references to small and large Ruby objects are pointers. The exception is for tiny objects, which live completely in the reference.

Think about the last three bits of Ruby’s 8-byte references. You know that if those last bits are all zeroes, the value is (or could be) a pointer to something returned by the memory allocator - so it’s a small or large object. But if they’re not zero, the value lives in the reference and it’s a tiny object.

And Ruby is going to pass around a lot of values that you’d like to be small and fast… Numbers, say, or symbols. Heck, you’d like nil to be pretty small and fast too.

So: CRuby has a few things that it calls “immediate” values in its source code. And the list of those immediate values look exactly like the list above - values you can store as tiny objects directly in a reference.

Let’s get back to those last three bits of the reference again.

If the final bit is a “1” then the reference contains a Fixnum. If the final two bits are “10” then it’s a Float. And if the last four bits are “1100” then it’s a Symbol. But the last three of “1100” are still illegal for an allocated pointer, so it works out.

The four “special” values (true, false, undef, nil) are all represented by small numbers that will also never be returned by the memory allocator. For completeness, here they are:

ValueHexadecimal valueDecimal value
true0x1420
false0x000
undef0x3452
nil0x088

So Every Integer Ends in 1, Then?

You might reasonably ask… but what about even integers?

I mean, “ends in 1” is a reasonable way to distinguish between pointers and not-pointers. But what if you want to store the number 4 at some point? Its binary representation ends in “00,” not “1.” The number 88 is even worse - like a pointer, it’s a multiple of 8!

It turns out that CRuby stores your integer in just the top 63 bits out of 64. The final “1” bit isn’t part of the integer’s value, it’s just a sign saying, “yup, this is an integer.” So if type-tagging is two values with one tagging the other, then the bottom bit is the tag and the top 63 bits are the “other” piece of data. They’re both crunched together, but… Well, this is C. If you want to crunch up “multiple” pieces of data into one chunk… C isn’t your mother, and it won’t stop you. In fact, that’s what C does with all its arrays anyway. And in this case it makes for pretty fast code, so that’s what CRuby does.

If you’re up for it, here’s the C code for immediate Fixnums - all this code makes heavy use of bitwise operations, as you’d expect.

// Check if a reference is an immediate Fixnum
#define RB_FIXNUM_P(f) (((int)(SIGNED_VALUE)(f))&RUBY_FIXNUM_FLAG)

// Convert a C int into a Ruby immediate Fixnum reference
#define RB_INT2FIX(i) (((VALUE)(i))<<1 | RUBY_FIXNUM_FLAG)

// Convert a Ruby immediate Fixnum into a C int - RSHIFT is just >>
#define RB_FIX2LONG(x) ((long)RSHIFT((SIGNED_VALUE)(x),1))

So It’s All That Simple, Then?

This article can’t cover everything. If you think about symbols for a moment, you’ll realize they have to be a bit more complicated than that - what about a symbol like :thisIsAParticularlyLongName? You can’t fit that in 8 bytes! And yet it’s still an immediate value. Spoiler: Ruby keeps a table that maps the symbol names to fixed-length keys. This is another very old trick, often called String Interning.

And as for what it does to the Float representation… I’ll get into a lot more detail about that, and about what it does to Ruby’s floating-point performance, in a later post.

Wrk: Does It Matter If It Has Native No-Keepalive?

I wrote about a load-tester called Wrk a little while ago. Wrk is unusual among load testers in that it doesn’t have an option for turning off HTTP keepalive. HTTP 1.1 defaults to having KeepAlive, and it helps performance significantly… But shouldn’t you allow testing with both? Some intermediate software might not support KeepAlive, and HTTP 1.0 only supports it in an optional mode. Other load-testers normally allow turning it off. Shouldn’t Wrk allow it too?

Let’s explore that, and run some tests to check how “real” No-KeepAlive performs.

In this post I’m measuring with Rails Simpler Bench, using 110 60-seconds batches of HTTP requests with a 5-second warmup for each. It’s this experiment configuration file, but with more batches.

Does Wrk Allow Turning Off KeepAlive?

First off, Wrk has a workaround. You can supply the “Connection: Close” header, which asks the server to kill the connection when it’s finished processing the request. To be clear, that will definitely turn off KeepAlive. If the server closes the connection after processing each and every request, there is no keepAlive. Wrk also claims in the bug report that you can do it with their Lua scripting. First off, I don’t think that’s true since Wrk’s Lua API doesn’t seem to have any way to directly close a connection. Second off, supplying the header on the command line is easy and writing correct Lua is harder. You could set the header in Lua, but that’s not any better or easier than doing it on the command line, unless you want to somehow do it conditionally, and only some of the time.

(Wondering how to make no-KeepAlive happen, practically speaking? wrk -H ”Connection: Close” will do it.)

Is it the same thing? Is supplying a close header the same as turning off KeepAlive?

Mostly yes, but not quite 100%.

When you supply the “close” header, you’re asking the server to close the connection afterward. Let’s assume the server does that since basically any correct HTTP server will.

But when you turn off KeepAlive on the client, you’re closing it client-side rather than waiting and detecting when the server has closed the socket. So: it’s about who initiates the socket close. Technically wrk will also just keep going with the same connection if the server somehow doesn’t correctly close the socket… But that’s more of a potential bug than an intentional difference.

It’s me writing this, so you may be wondering: does it make a performance difference?

Difference, No Difference, What’s the Difference?

First off, does KeepAlive itself make a difference? Absolutely. And like any protocol-level difference, how much you care depends on what you’re measuring. If you spend 4 seconds per HTTP requests, the overhead from opening the connection seems small. If you’re spending a millisecond per request, suddenly the same overhead looks much bigger. Rails, and even Rack, have pretty nontrivial overhead so I’m going to answer in those terms.

Yeah, KeepAlive makes a big difference.

Specifically, here’s RSB with a simple “hello, world” Rack route with and without the header-based KeepAlive hack:

ConfigThroughputStd Deviation
wrk w/ no extra header13577302.8
wrk -H "Connection: Close"10185263.4


That’s in the general neighborhood of 30% faster with KeepAlive. Admittedly, this is an example with tiny, fast routes and minimal network overhead. But more network overhead may actually make KeepAlive even faster, relatively, because if you turn off KeepAlive it has to make a new network connection for every request.

So whether “hack no-KeepAlive” versus “real no-KeepAlive” makes a difference, definitely “KeepAlive” versus “no KeepAlive” makes a big difference.

What About Client-Disconnect?

KeepAlive isn’t a hard feature to add to a client normally. The logic for “no KeepAlive” is really simple (close the connection after each request.) What if we check client-closed versus server-closed KeepAlive?

I’ve written a very small patch to wrk to turn off KeepAlive with a command-line switch. There’s also a much older PR to wrk that does this using the same logic, so I didn’t file mine separately — I don’t think this change will get upstreamed.

In fact, just in case I broke something, I wound up testing several different wrk configurations with varying results… These are all using the RSB codebase, with 5 different variants for the wrk command line.

Below, I use “new_wrk” to mean my patched version of wrk, while “old_wrk” is wrk without my —no-keepalive patch.

wrk commandThroughput (reqs/sec)Std Deviation
old_wrk13577302.8
old_wrk -H "Connection: Close"10185263.4
new_wrk13532310.9
new_wrk --no-keepalive7087108.3
new_wrk -H "Connection: Close"10193261.7

I see a couple of interesting results here. First off, there should be no difference between old_wrk and new_wrk for the normal and header-based KeepAlive modes… And that’s what I see. If I don’t turn on the new command line arg, the differences are well within the margin of measurement error (13577 vs 13532, 10185 vs 10193.)

However, the new client-disconnected no-KeepAlive mode is around 30% slower than the “hacked” server-disconnected no-KeepAlive! That means it’s around 60% slower than with KeepAlive! I strongly suspect what’s happening is that a server-disconnected KeepAlive mode winds up sending the “close” request alongside the request data, while a client-disconnect winds up making a whole extra network round trip.

A Very Quick Ruby Note - Puma and JRuby

You might reasonably ask if there’s anything Ruby-specific here. Most of this isn’t - it’s experimenting on a load tester and just using a Ruby server to check against, after all.

However, there’s one very important Ruby-specific note for those of you who have been reading carefully.

Most of my posts here are related to work I’m doing on Ruby. This one is no exception.

Puma has some interesting KeepAlive-related bugs, especially in combination with JRuby. If you find yourself getting unreasonably slow results for no reason, especially with Puma and/or JRuby, try turning KeepAlive on or off.

The Puma and JRuby folks are both looking into it. Indeed, I found this bug while working with the JRuby folks.

Conclusions

There are several interesting takeaways here, depending on your existing background.

  • KeepAlive speeds up a benchmark a lot; if there’s no reason to turn it off, keep it on

  • wrk doesn’t have a ‘real’ way to turn off KeepAlive (most load testers do)

  • you can use a workaround to turn off KeepAlive for wrk… and it works great

  • if you turn off KeepAlive, make sure you’re still getting not-utterly-horrible performance

  • be careful combining Puma and/or JRuby with KeepAlive - test your performance

And that’s what I have for this week.

Where Does Rails Spend Its Time?

You may know that I run Rails Ruby Bench and write a fair bit about it. It’s intended to answer performance questions about a large Rails app running in a fairly real-world configuration.

Here’s a basic question I haven’t addressed much in this space: where does RRB actually spend most of its time?

I’ve used the excellent StackProf for the work below. It was both very effective and shockingly painless to use. These numbers are for Ruby 2.6, which is the current stable release in 2019.

(Disclaimer: this will be a lot of big listings and not much with the pretty graphs. So expect fairly dense info-dumps punctuated with interpretation.)

About Profiling

It’s hard to get high-quality profiling data that is both accurate and complete. Specifically, there are two common types of profiling and they have significant tradeoffs. Other methods of profiling fall roughly into these two categories, or a combination of them:

  • Instrumenting Profilers: insert code to track the start and stop points of whatever it measures; very complete, but distorts the accuracy by adding extra statements to the timing; usually high overhead; don’t run them in production

  • Sampling Profilers: every so many milliseconds, take a sample of where the code currently is; statistically accurate and can be quite low-overhead, but not particularly complete; fast parts of the code often receive no samples at all; don’t use them for coverage data; fast ones can be run in production

StackProf is a sampling profiler. It will give us a reasonably accurate picture of what’s going on, but it could easily miss methods entirely if they’re not much of the total runtime. It’s a statistical average of samples, not a Platonic ideal analysis. I’m cool with that - I’m just trying to figure out what bits of the runtime are large. A statistical average of samples is perfect for that.

I’m also running it for a lot of HTTP requests and adding the results together. Again, it’s a statistical average of samples - just what I want here.

Running with a Single Thread

Measuring just one process and one thread is often the least complicated. You don’t have to worry about them interfering with each other, and it makes a good baseline measurement. So let’s start with that. If I run RRB in that mode and collect 10,000 requests, here are the top (slowest) CPU-time entries, as measured by StackProf.

(I’ve removed the “total” columns from this output in favor of just the “samples” columns because “total” counts all methods called by that method, not just the method itself. You can get my original data if you’re curious about both.)

==================================
  Mode: cpu(1000)
  Samples: 4293 (0.00% miss rate)
  GC: 254 (5.92%)
==================================
SAMPLES    (pct)     FRAME
    206   (4.8%)     ActiveRecord::Attribute#initialize
    189   (4.4%)     ActiveRecord::LazyAttributeHash#[]
    122   (2.8%)     block (4 levels) in class_attribute
     98   (2.3%)     ActiveModel::Serializer::Associations::Config#option
     91   (2.1%)     block (2 levels) in class_attribute
     90   (2.1%)     ActiveSupport::PerThreadRegistry#instance
     85   (2.0%)     ThreadSafe::NonConcurrentCacheBackend#[]
     79   (1.8%)     String#to_json_with_active_support_encoder
     70   (1.6%)     ActiveRecord::ConnectionAdapters::PostgreSQLAdapter#exec_no_cache
     67   (1.6%)     ActiveModel::Serializer#include?
     65   (1.5%)     SiteSettingExtension#provider
     59   (1.4%)     block (2 levels) in <class:Numeric>
     51   (1.2%)     ActiveRecord::ConnectionAdapters::PostgreSQL::Utils#extract_schema_qualified_name
     50   (1.2%)     ThreadSafe::NonConcurrentCacheBackend#get_or_default
     50   (1.2%)     Arel::Nodes::Binary#hash
     49   (1.1%)     ActiveRecord::Associations::JoinDependency::JoinPart#extract_record
     49   (1.1%)     ActiveSupport::JSON::Encoding::JSONGemEncoder::EscapedString#to_json
     48   (1.1%)     ActiveRecord::Attribute#value
     46   (1.1%)     ActiveRecord::LazyAttributeHash#assign_default_value
     45   (1.0%)     ActiveSupport::JSON::Encoding::JSONGemEncoder#jsonify
     45   (1.0%)     block in define_include_method
     43   (1.0%)     ActiveRecord::Result#hash_rows

There are a number of possibly-interesting things here. I’d probably summarize the results as “6% garbage collection, 17%ish ActiveRecord/ActiveModel/ARel/Postgres, around 4-6% JSON and serialization, and some cache and ActiveSupport various like class_attribute.” That’s not bad - with the understanding that ActiveRecord is kinda slow, and this profiler data definitely reflects that. A fast ORM like Sequel would presumably do better for performance, though it would require rewriting a bunch of code.

Running with Multiple Threads

You may recall that I usually run Rails Ruby Bench with lots of threads. How does that change things? Let’s check.

==================================
  Mode: cpu(1000)
  Samples: 40421 (0.51% miss rate)
  GC: 2706 (6.69%)
==================================
SAMPLES    (pct)     FRAME
   1398   (3.5%)     ActiveRecord::Attribute#initialize
   1169   (2.9%)     ActiveRecord::LazyAttributeHash#[]
    999   (2.5%)     ThreadSafe::NonConcurrentCacheBackend#[]
    923   (2.3%)     block (4 levels) in class_attribute
    712   (1.8%)     ActiveSupport::PerThreadRegistry#instance
    635   (1.6%)     block (2 levels) in class_attribute
    613   (1.5%)     ActiveModel::Serializer::Associations::Config#option
    556   (1.4%)     block (2 levels) in <class:Numeric>
    556   (1.4%)     Arel::Nodes::Binary#hash
    499   (1.2%)     ActiveRecord::Result#hash_rows
    489   (1.2%)     ActiveRecord::ConnectionAdapters::PostgreSQLAdapter#exec_no_cache
    480   (1.2%)     ThreadSafe::NonConcurrentCacheBackend#get_or_default
    465   (1.2%)     ActiveModel::Serializer#include?
    436   (1.1%)     Hashie::Mash#convert_key
    433   (1.1%)     SiteSettingExtension#provider
    407   (1.0%)     ActiveRecord::ConnectionAdapters::PostgreSQL::Utils#extract_schema_qualified_name
    378   (0.9%)     String#to_json_with_active_support_encoder
    360   (0.9%)     Arel::Visitors::Reduce#visit
    348   (0.9%)     ActiveRecord::Associations::JoinDependency::JoinPart#extract_record
    343   (0.8%)     ActiveSupport::TimeWithZone#transfer_time_values_to_utc_constructor
    332   (0.8%)     ActiveSupport::JSON::Encoding::JSONGemEncoder#jsonify
    330   (0.8%)     ActiveSupport::JSON::Encoding::JSONGemEncoder::EscapedString#to_json
    328   (0.8%)     ActiveRecord::Type::TimeValue#new_time

This is pretty similar. ActiveRecord is showing around 20%ish rather than 17%, though doesn’t reflect any of the smaller components, anything under 1% of the total (plus it’s sampled.) The serialization is still pretty high, around 4-6%.

If I try to interpret these results, the first thing I should point out is that they’re quite similar. While running with 6 threads/process is adding to (for instance) the amount of time spent on cache contention and garbage collection, it’s not changing it that much. Good. A massive change there is either a huge optimization that wouldn’t be available for single-threaded, or (more likely) a serious error of some kind.

If GC is High, Can We Fix That?

It would be reasonable to point out that 7% is a fair bit for garbage collection. It’s not unexpectedly high and Ruby has a pretty good garbage collector. But it’s high enough that it’s worth looking at - a noticeable change there could be significant.

There’s a special GC profile mode that Ruby can use, where it keeps track of information about each garbage collection that it does. So I went ahead and ran StackProf again with GC profiling turned on - first in the same “concurrent” setup as above, and then with jemalloc turned on to see if it had an effect.

The short version is: not really. Without jemalloc, the GC profiler collected records of 2.4 seconds of GC time over the 10,000 HTTP requests… And with jemalloc, it collected 2.8 seconds of GC time total. I’m pretty sure what we’re seeing is that jemalloc’s primary speed advantage is during allocation and freeing… And with Ruby using a deferred sweep happening in a background thread, it’s a good bet that neither of these things count as garbage collection time.

This is one of those GC::PRofiler reports. You can also get it as a Ruby hash table and then dump that, which makes it a bit easier to analyze in irb later.

This is one of those GC::PRofiler reports. You can also get it as a Ruby hash table and then dump that, which makes it a bit easier to analyze in irb later.

I also took more StackProf results with profiling on, but 1) they’re pretty similar to the other results and 2) GC profiling actually takes enough time to distort the results a bit, so they’re likely to be less accurate than the ones above.

What Does All This Suggest?

There are a few interesting leads we could chase from here.

For instance, could JSON be lower? Looking through Discourse’s code, it’s using the oj gem via MultiJSON. OJ is pretty darn fast, so that’s probably going to be hard to trim to less of the time. And MultiJSON might be adding a tiny bit of overhead, but it shouldn’t be more than that. So we’d probably need a structural or algorithmic change of some kind (e.g. different caching) to lower JSON overhead. And for a very CRUD-heavy app, this isn’t an unreasonable amount of serialization time. Overall, I think Discourse is serializing pretty well, and these results reflect that.

ActiveRecord is a constant performance bugbear in Rails, and Discourse is certainly no exception. I use this for benchmarking and I want “typical” not “blazing fast,” so this is pretty reassuring for me personally - yup, that’s what I’m used to seeing slow down a Rails app. If you’re optimizing rather than benchmarking, the answers are 1) the ActiveRecord team keep making improvements and 2) consider using something other than ActiveRecord, such as Sequel. None of them are 100% API-interoperable with ActiveRecord, but if you’re willing to change a bit of code, some Ruby ORMs are surprisingly fast. ActiveRecord is convenient, flexible, powerful… but not terribly fast.

Since jemalloc’s not making much different in GC… in a real app, the next step would be optimization and trying to create less garbage. Again, for me personally, I’m benchmarking, so lots of garbage per request means I’m doing it right. Interestingly, jemalloc does seem to speed up Rails Ruby Bench significantly, so these results don’t mean it’s not helping. If anything, this may be a sign that StackProf’s measurement doesn’t do very well at measuring jemalloc’s results - perhaps it isn’t catching differences in free() call time? And garbage collection can be hard to measure well in any case.

Methodology

This is mostly just running for 10,000 requests and seeing what they look like added/averaged together. There are many reasons not to take this as a perfect summary, starting with the fact that the server wasn’t restarted to give multiple “batches” the way I normally do for Rails Ruby Bench work. However, I ran it multiple times to make sure the numbers basically hold up, and they basically seem to.

Don’t think of this as a bulletproof and exact summary of where every Rails app spends all its time - it wouldn’t be anyway. It’s a statistical summary, it’s a specific app and so on. Instead, you can think of it as where a lot of time happened to go one time that some guy measured… And I can think of it as grist for later tests and optimizations.

As for specifically how I got StackProf to measure the requests… First, of course, I added the StackProf gem to the Gemfile. Then in config.ru:

use StackProf::Middleware,
  enabled: true,
  mode: :cpu,
  path: "/tmp/stackprof",  # to save results
  interval: 1000,          # ms between samples
  save_every: 50           # save .dump file each this many results

You can see other configuration options in the StackProf::Middleware source.

Conclusions

Here are a few simple takeaways:

  • Even when configured well, a Rails CRUD app will spend a fair bit of time on DB querying, ActiveRecord overhead and serialization,

  • Garbage collection is a lot better than in Ruby 1.9, but it’s still a nontrivial chunk of time; try to produce fewer garbage objects where you can,

  • ActiveRecord adds a fair bit of overhead on top of the DB itself; consider alternatives like Sequel and whether they’ll work for you,

  • StackProf is easy and awesome and it’s worth trying out on your Ruby app

See you in two weeks!

Ruby 2.7 and the Compacting Garbage Collector

Aaron Patterson, aka Tenderlove, has been working on a compacting garbage collector for Ruby for some time. CRuby memory slots have historically been quirky, and may take some tweaking - this makes them a bit simpler since the slot fragmentation problem can (potentially) go away.

Rails Ruby Bench isn’t the very best benchmark for this, but I’m curious what it will show - it tends to show memory savings as speed instead, so it’s not a definitive test for “no performance regressions.” But it can be a good way to check how the performance and memory tradeoffs balance out. (What would be “the best benchmark” for this? Probably something with a single thread of execution, limited memory usage and a nice clear graph of memory usage over time. That is not RRB.)

But RRB is also, not coincidentally, a great torture test to see how stable a new patch is. And with a compacting garbage collector, we care a great deal about that.

How Do I Use It?

Memory compaction doesn’t (yet) happen automatically. You can see debate in the Ruby bug about that, but the short version is that compaction is currently expensive, so it doesn’t (yet) happen without being explicitly invoked. Aaron has some ideas to speed it up - and it’s only just been integrated into a very pre-release Ruby version. So you should expect some changes before the Christmas release of Ruby 2.7.

Instead, if you want compaction to happen, you should call GC.compact. Most of Aaron’s testing is by loading a large Rails application and then calling GC.compact before forking. That way all the class code and the whole set of large, long-term Ruby objects get compacted with only one compaction. The flip side is that newly-allocated objects don’t benefit from the compaction… But in a Rails app, you normally want as many objects preloaded as possible anyway. For Rails, that’s a great way to use it.

How do you make that happen? I just added an initializer in config/initializers containing only the code “GC.compact” that runs after all the others are finished. You could also use a before-fork hook in your application server of choice.

If you aren’t using Rails and expect to allocate slowly over a long time, it’s a harder question. You’ll probably want to periodically call GC.compact but not very often - it’s slower than a full manual GC, for instance, so you wouldn’t do it for every HTTP request. You’re probably better off calling it hourly or daily than multiple times per minute.

Testing Setup

For stability and speed testing, I used Rails Ruby Bench (aka RRB.)

RRB is a big concurrent Rails app processing a lot of requests as fast as it can. You’ve probably read about it here before - I’m not changing that setup significantly. For this test, I used 30 batches of 30,000 HTTP requests/batch for each configuration. The three configurations were “before” (the Ruby commit before GC compaction was added,) “after” (Ruby compiled at the merge commit) and “after with compaction” (Ruby at the merge commit, but I added an initializer to Discourse to actually do compaction.)

For the “before” commit, I used c09e35d7bbb5c18124d7ab54740bef966e145529. For “after”, I used 3ef4db15e95740839a0ed6d0224b2c9562bb2544 - Aaron’s merge of GC compact. That’s SVN commit 67479, from Feature #15626.

Usually I give big pretty graphs for these… But in this case, what I’m measuring is really simple. The question is, do I see any speed difference between these three configurations?

Why would I see a speed difference?

First, GC compaction actually does extra tracking for every memory allocation. I did see a performance regression on an earlier version of the compaction patch, even if I never compacted. And I wanted to make sure that regression didn’t make it into Ruby 2.7.

Second, GC compaction might save enough memory to make RRB faster. So I might see a performance improvement if I call GC.compact during setup.

And, of course, there was a chance that the new changes would cause crashes, either from the memory tracking or only after a compaction had occurred.

Results and Conclusion

The results themselves look pretty underwhelming, in the sense that they don’t have many numbers in them:

“Before” Ruby: median throughput 182.3 reqs/second, variance 43.5, StdDev 6.6

“After” Ruby: median throughput 179.6 reqs/second, variance 0.84, StdDev 0.92

“After” Ruby w/ Compaction: median throughput 180.3 reqs/second, variance 0.97, StdDev 0.98

But what you’re seeing there is very similar performance for all three variants, well within the margin of measurement error. Is it possible that the GC tracking slowed RRB down? It’s possible, yes. You can’t really prove a negative, which in this case means I cannot definitively say “these are exactly equal results.” But I can say that the (large, measurable) earlier regression is gone, but I’m not seeing significant speedups from the (very small) memory savings from GC compaction.

Better yet, I got no crashes in any of the 90 runs. That has become normal and expected for RRB runs… and it says good things about the stability of the new GC compaction patch.

You might ask, “does the much lower variance with GC compaction mean anything?” I don’t think so, no. Variance changes a lot from run to run. It’s imaginable that the lower variance will continue and has some meaning… and it’s just as likely that I happened to get two low-variance runs for the last two “just because.” That happens pretty often. You have to be careful reading too much into “within the margin of error” or you’ll start seeing phantom patterns in everything…

The Future

A lot of compaction’s appeal isn’t about immediate speed. It’s about having a solution for slot fragmentation, and about future improvements to various Ruby features.

So we’ll look forward to automatic periodic compaction happening, likely also in the December 2019 release of Ruby 2.7. And we’ll look forward to certain other garbage collection problems becoming tractable, as Ruby’s memory system becomes more capable and modern.

"Wait, Why is System Returning the Wrong Answer?" - A Debugging Story, and a Deep Dive into Kernel#system

I had a fun bug the other day - it involved a merry chase, many fine wrong answers, a disagreement across platforms… And I thought it was a Ruby bug, but it wasn’t. Instead it’s one of those not-a-bugs you just have to keep in mind as you develop.

And since it’s a non-bug that’s hard to find and hard to catch, perhaps you’d like to hear about it?

So… What Happened?

Old-timers may instantly recognize this problem, but I didn’t. This is one of several ways it can manifest.

I had written some benchmarking code on my Mac, I was running it on Linux, and a particular part of it was misbehaving. Specifically, I was using curl to see if the URL was available - if a server was running and accepting connections yet. Curl will return true if the connection succeeds and gets output, and return false if it can’t connect or gets an error. I also wanted to redirect all output, because I didn’t want a console message. Seems easy enough, right? It worked fine on my Mac.

    def url_available?
      system("curl #{@url} &>/dev/null")  # This doesn't work on Linux
    end

The “&>/dev/null” part redirects both STDOUT and STDERR to /dev/null so you don’t see it on the console.

If you try it out yourself on a Mac it works pretty well. And if you try it on Linux, you’ll find that whether the URL is available or not it returns true (no error), so it’s completely useless.

However, if you remove the output redirect it works great on both platforms. You just get error output to console if it fails.

Wait, What?

I wondered if I had found an error in system() for awhile. Like, I added a bunch of print statements into the Ruby source to try and figure out what was going on. It doesn’t help that I tried several variations of the code and checked $? to see if the process had returned error and… basically confused myself a fair bit. I was nearly convinced that system() was returning true but $?.success? was returning false, which would have been basically impossible and would have meant a bug in Ruby.

Yeah, I ran down a pretty deep rabbit hole on this one.

In fact, the two commands wind up passing the same command line on Linux and MacOS. And if you run the command it passes in bash, you’ll get the same return value in bash - you can check by printing out $?, a lot like in Ruby.

A Quick Dive into Kernel#System

Let’s talk about what Kernel#system does, so I can explain what I did wrong.

If you include any special characters in your command (like the output redirection), Ruby will run your command in a subshell. In fact, system will do a few different things. In fact, system will do many different things.

If your command is just a string with no special characters, it will run it fairly directly: “ls” will simply run “ls”, and “ls bob” will run “ls” with the single argument “bob”. No great surprise.

If your command does have special characters, though, such as ampersand, dollar sign or greater-than, it assumes you’re doing some kind of shell trickery - it runs "/bin/sh” and passes whatever you gave it as an argument ("/bin/sh” with the arguments “-c” and whatever you gave to Kernel#system.)

You can also pass an array for more control - [“ls”, “bob”], for instance, will do the same thing as passing “ls bob” into Kernel#system, but with perhaps a bit more control - you can make sure it’s not running a subshell and you can automatically quote things without adding a bunch of double-quotes.

# Examples
system("ls")                 # runs "ls"
system("ls bob")             # runs "ls" w/ arg "bob"
system(["ls", "bob"])        # runs "ls" w/ arg "bob"
system("ls bob 2>/dev/null") # runs sh -c "ls bob 2>/dev/null"

No Really, What Went Wrong?

My code up above uses special characters. So it uses /bin/sh. I tried it on the Mac, it worked fine. Here’s the important difference that I missed:

On a Mac, /bin/sh is the same as bash. On Linux it isn’t.

Linux includes a much simpler shell it installs as /bin/sh, without a lot of bash-specific features. One of those bash-specific features is the ampersand-greater-than syntax that I used to redirect stdout and stderr at the same time. There’s a way to do it that’s compatible with both, but that version isn’t. And in this specific case, it always winds up returning true for /bin/sh, even if the command fails.

Oops.

So in some sense, I used a bash-specific command and I should fix that. I’ll show how to fix it that way below.

Or in a different sense, I used a big general-purpose hammer (a shell) for something I could have done simply and specifically in Ruby. I’ll fix it that way too, farther down.

How Should I Fix This?

Here’s a way to fix the shell incompatibility, simply and directly:

def url_available?
  system("curl #{@url} 1>/dev/null 2>&1")  # This works on Mac and Linux
end

This will redirect stdout to /dev/null, then redirect stderr to stdout. It works fine, and it’s a syntax that’s compatible with both bash and Linux’s default /bin/sh.

This way is fine. It does what you want. It’s enough. Indeed, as I write this it’s the approach I used to fix it in RSB.

There’s also a cleaner way, though it takes slightly more Ruby code. Let’s talk about Kernel#system a bit more and we can see how. It’s a more complex method, but you get more control over what gets called and how.

System’s Gory Glory

In addition to the command argument above, the one that can be an array or a processed string, there are extra “magic” arguments ahead and behind. There’s also another trick in the first argument - Kernel#system is like one of those “concept” furniture videos where everything unfolds into something else.

You saw above that command can be (documented here):

  • A string with special characters, which will expand into /bin/sh -c “your command”

  • A string with no special characters, which will directly run the command with no wrapping shell

  • An array of strings, which will run array[0] as the command and pass the rest as args

  • An array of strings except array[0] is a two-element array of strings - that will do the same as an array of strings, except the first entry is [ newArgv0Value, commandName ]. If this sounds confusing, you should avoid it.

But you can also pass an optional hash before the command. If you do, that hash will be:

  • A hash of new environment variable values; normally these will be added to the parent process’s environment to get the new child environment. But see “options” below.

And you can also pass an optional hash after the command. If you do, that hash may have different keys to do different things (documented here), including:

  • :unsetenv_others - if true, unset every environment variable you didn’t pass into the first optional hash

  • :close_others - if true, close every file descriptor except stdout, stdin or stderr that isn’t redirected

  • :chdir - a new current directory to start the process in

  • :in, :out, :err, strings, integers, Io objects or arrays - redirect file descriptors, according to a complicated scheme

I won’t go through all the options because there are a lot of them, mostly symbols like the first three above.

But that last one looks promising. How would we do the redirect we want to /dev/null to throw away that output?

In this case, we want to redirect stderr and stdout both to /dev/null. Here’s one way to do that:

def url_available?
  system(["curl", @url], 1 => [:child, 2], 2 => "/dev/null") # This works too
end

That means to redirect the child’s stdout (file descriptor 1) to its own stderr, and direct its stderr to (the file, which will be opened) /dev/null. Which is exactly what we want to do, but also a slightly awkward syntax for it. However, it guarantees that we won’t run an extra shell, and we won’t have to turn the arguments into a string and re-parse them, and we won’t have to worry about escaping the strings for a shell.

Once more, to see documentation for all the bits and bobs that system (and related calls like Kernel#spawn) can accept, here it is.

Here are more examples of system’s “fold-out” syntax with various pieces added:

# Examples
system({'RAILS\_ENV' => 'profile'}, "rails server") # Set an env var first
system(["rails", "server"], pgroup: true) # Run server in a new process group
system("ls *", 2 => [:child, 1]) # runs sh -c "ls *" with stderr and stdout merged
system("ls *", 2 => :close) # runs sh -c "ls *" with stderr closed

Conclusion

Okay, so what’s the takeaway? Several come to mind:

  • /bin/sh is different on Mac (where it’s bash) and Linux (where it’s simpler and smaller)

  • It’s easy to use incompatible shell commands, and hard to test cross-platform

  • Ruby has a lot of shell-like functionality built into Kernel#system and similar calls - use it

  • By doing a bit of the shell’s work yourself (command parsing, redirects) you can save confusion and incompatibility

And that’s all I have for today.

Why is Ruby Slower on Mac? An Early Investigation

Sam Saffron has been investigating Discourse test run times on different platforms. While he laments spending so much extra time by running Windows, what strikes me most is the extra time on Mac — which many, many Rubyists use as their daily driver.

So which bits are slow? This is just a preliminary investigation, and I’m sure I’ll do more looking into it. But at first blush, what seems slow?

I’m curious for multiple reasons. One: is Mac is so slow, is it better to run under Docker, or with an external VM, rather than the Mac? Two: why is it slow? Can we characterize what is so slow and either do less of it or fix it?

First, let’s look at some tools and what they can or can’t tell us.

Ruby-Prof

Ruby-Prof is potentially interesting to show us just the rough outlines of what’s slow. It’s not great for the specifics because it’s an instrumenting profiler rather than a sampling profiler, and that distorts the results a bit. So: only good for the big picture. In general, you should expect an instrumenting profiler to add a bit of time to each method call, so you’d expect it to “flatten” results a bit - fast methods will seem a bit slower, and methods that take a long time won’t seem as much slower as they actually are.

Also, Ruby-Prof takes a long time to write out larger output, which can be a problem if you run it under an application server like Puma - when it starts writing out a large result set, Puma is likely to kill it because the “request” is taking too long. So it also has limited utility for that reason.

As a result, I don’t really trust my current Rails results with it. There’s too much potential for severe sampling bias. Instead, let’s look at what it says about a non-HTTP CPU benchmark, OptCarrot.

I’m testing on very different machines - a MacbookPro laptop running a normal MacOS UI versus a dedicated Amazon EC2 instance (m4.2xlarge) running Linux with no UI. It’s fair to call those unequal — they are, in all sorts of ways. However, they’re actually fairly similar for the question we’re curious about, which goes, “how fast is running tests on my Mac laptop/desktop versus running it on a separate Linux server/VM?”

Some Results

The first question is, how stable are those results? This is a fairly key question — if the results aren’t stable, then what they are relative to each other is a very different question.

For instance, here’s what two typical sets of OptCarrot results from the dedicated instance look next to each other:

I’ve cut out some columns you don’t care about. You’ll see the occasional line switched, but notice that only happens when the %self is very similar.

I’ve cut out some columns you don’t care about. You’ll see the occasional line switched, but notice that only happens when the %self is very similar.

Pretty stable, right? What you’re looking at here is the leftmost column, the percentage of total time, as well as the order of the methods for how much of that time they take. In both cases, these listings are very solidly similar.

In other words, one of the primary Ruby CPU benchmarks used for Ruby 3x3, run on the most common platform for benchmarking, gives pretty solid results. But we were pretty sure of that, right?

How about on Mac, which is not a primary benchmarking platform for Ruby?

This is not Mac vs Linux, it’s Mac vs Mac on the same machine

This is not Mac vs Linux, it’s Mac vs Mac on the same machine

These percentages vary a little more. Different rows switch places more often. What you’re seeing is a “wobblier” result - one where the “same” run just has more variation. I observed the same thing with RSB on Mac, though this is the first time I’ve tried to quantify it a bit.

Is that because the MacOS UI is running? Maybe. The amount of variation here is larger than the amount that Apple shows running in the Activity Monitor, but that doesn’t guarantee anything. And of course “how much is OS overhead?” is a really hard question to answer.

So… What’s not here?

After the wobble is accounted for, I don’t see any one or few methods that are massively slower on Mac. So this doesn’t look like there’s just a few operations here that are slowing everything way down. That’s a bit disappointing — wouldn’t it be nice if we could just fix a couple of things? But it makes sense.

Several things don’t seem to be in the listing above: extra garbage collection time could be distributed across all these categories, or it could manifest as a large spike in just a few places — I don’t see anything like that spike, not on any of my runs. So Mac does not seem to be slower because of a few spikes in garbage collection time. Given that the Mac memory allocator is supposed to be slower, that’s important to check. It could be an overall slower allocator — OptCarrot doesn’t do a lot of memory allocation, but OptCarrot isn’t showing up as a lot slower.

And in fact, I don’t think I’m seeing a huge slowdown. Comparing two different hosts this way isn’t in any way fair or representative, but Sam was seeing around a 2X slowdown on Mac in his Discourse results, and that’s not subtle. I don’t think I’m seeing a slowdown of that magnitude for OptCarrot. Sounds like I should be comparing some Rails and/or RSpec projects like Discourse - perhaps something there is the problem.

(Why didn’t I start with Discourse? Basically, because it’s hard to configure and even harder to configure the same. The odds that I’d spend days chasing down something that wasn’t even his problem are surprisingly high. Also, Docker or no Docker? Docker is now how people configure Discourse on Mac mostly, but is has completely different performance for a lot of common things - like files.)

Basics and Fundamentals

OptCarrot and Ruby-Prof aren’t instantly showing anything useful. So let’s step back a bit. What problems can Ruby fix vs not fix? What’s our basic situation?

Well, what if the Mac is somehow magically slower across the board at everything? Seems a bit unlikely, but we haven’t ruled it out. If the Mac was just as slow with random compiled C binaries, then there’s not much Ruby could do about this. It’s not like we’re going to skip GCC and start emitting our own compiled binaries.

If we wanted to check that, we could do more of an apples-to-apples comparison between Mac and Linux. Comparing a laptop to a virtualized server instance is, of course, not even slightly an apples-to-apples comparison.

But it’s worse than that. Hang on.

Sam strongly suggested installing Linux and Mac on the same machine dual-boot for testing — that’s the only way you’ll be sure you have the same exact speed. Even two of the same model fresh off the line aren’t necessarily the exact same speed as each other, for all sorts of good reasons. Slight CPU variation is the norm, not the exception.

And worse yet: you can’t run OS X headless, not really. Dual-boot will still have more processes running in the background in OS X, and slightly different compiler, and memory allocator, and… Yeah. So the exact same machine with dual-boot won’t give a proper apples-to-apples comparison.

It’s a good thing we don’t need one of those, isn’t it?

What We Can Get

Most of what we want to know is, is Ruby somehow slower than it should be on Mac? And if so, is it because of something at the Ruby level? If it’s not at the Ruby level then we can measure it and warn people, but not much more.

So first off, how do the speed of those two hosts compare? You can check a mid-2015-era Macbook Pro against an EC2 m4.2xlarge on GeekBench.com - and for single-core CPU benchmarks, they seem to think the Macbook is pretty poky - about 2.5 GB/sec while the Linux server gets 3.7 GB/sec. The Mac does better for overall rating (4264 single-core vs 2929 single-core), but it’s hard to tell what that means with so few tests run in common.

Okay, so then how do we compare? I downloaded the Phoronix test suite for both Mac and Linux to compare them and ran the CPU suite. That should at least give some similar results. Here are the tests in common I could easily get:

TestMacbookEC2 Linux instance
x265 3.0 (1080p video encoding)2.98fps2.64 fps
7-Zip Compression19859 MIPS18508 MIPS
Stockfish 97906720 Nodes Per Second7869399 Nodes Per Second


What I’m seeing there is basically that these are not dramatically different processors. And when I run optcarrot on them (also single-core) the Mac runs it at 39-40 fps pretty consistently, while (one core of) the EC2 instance runs it at 30fps. This is not obvious evidence for the Mac being slower at Ruby CPU benchmarks.

So: maybe what’s slow is something about Discourse? Or about Mac memory allocation or garbage collection?

Conclusions and Followups

All of this is initial work, and fairly simple. Expect more from me as I explore further.

What I’ve seen so far is:

  • Mac CPU benchmarks don’t seem especially slow in Ruby as opposed to out of Ruby

  • The relative speed of different operations seems fairly consistent between Linux and Mac Ruby

  • Mac takes a hit on both speed and consistency by running a UI and a fairly “busy” OS

Followups that are likely to be useful:

  • Discourse, most especially its test suite; this is what Sam found to be very slow

  • Other profiling tools like stackprof - ruby-prof’s “flattening” of performance may be hiding a problem

  • Garbage collection and memory performance

  • Filesystem I/O

Look for me from me on this topic in the coming weeks!

JIT Performance with a Simpler Benchmark

There have been some JIT performance improvements in Ruby 2.7, which is still prerelease. And lately I’m using a new, simpler benchmark lately for researching Ruby performance.

Hey - wasn’t JIT supposed to be easier to make work on simpler code? Let’s see how JIT, including the prerelease code, works with that new benchmark.

(Just wanna see graphs? These are fairly simple graphs, but graphs are always good. Scroll down for the graphs.)

The Setup - Methodology

You may remember that Rails Simpler Bench currently uses “hello, world”-type very simple routes that just return a static string. That’s probably the best possible Rails use case for JIT. I’m starting with no concurrency, just a single request at once. That doesn’t show JIT’s full speedup, but it’s the most accurate and more reproducible to measure… And mostly, we want to know if JIT speeds things up at all rather than showing the largest possible speedup. I’m also measuring in both Rails and plain Rack, with Puma, on a dedicated-tenancy AWS EC2 m4.2xlarge instance. There’s no networking happening outside the instance itself, so this should give us nice low-noise results.

I wound up running one set of tests (everything Ruby 2.6.2) on one instance and the other set (everything with new prerelease Ruby) on another - so don’t treat this as an apples-to-apples comparison of prerelease Ruby’s speedup over 2.6.2. That’s okay, there’s all sorts of reasons that’s not a good idea to do anyway. Instead, we’re just checking the relative performance of JIT to no-JIT for each Ruby.

“New prerelease Ruby 2.7” is going to be accurate for a lot of different commits before the release around Christmastime. For this article, I’m using commit 025206d0dd29266771f166eb4f59609af602213a, which was new on May 9th. It’s what “git pull” got when I was getting ready to write this post.

Each of these runs is done with 10 batches of 4 minutes of HTTP requests, after 2 minutes of warmup for the server. I’m using Puma for the app server and wrk as the HTTP load generator. This should sound a lot like the setup for several of my recent blog posts. You can find the benchmark code here, based on a variation of this config file.

The Results

Let’s start with Rails - it’s what gets asked the most often. How does JIT do?

Takashi has made it clear that JIT isn’t expected to be faster for Rails… and that has been my experience as well. But he says the new JIT does better than in 2.6.

So let’s try. How does new prerelease JIT do compared to the released 2.6? First I’ll show you the graph, then I’ll give a bit of interpretation.

That thick line toward the bottom is the X axis, or “rate == 0.”

That thick line toward the bottom is the X axis, or “rate == 0.”

Those pink bars are an indication of the 10th, 50th and 90th percentile from lowest to highest. It’s like a box plot that way.

On the left, for Ruby 2.6.2, the JIT and no-JIT plots are pretty far apart. The medians are 1280 (No JIT) versus 1060 (w/ JIT), for instance. JIT is substantially slower, though not as much slower as for Rails Ruby Bench. That should make sense. JIT has an easier time on simpler code with shorter methods so Rails Ruby Bench is a terrible case for it. Rails Simpler Bench isn’t as bad.

Better yet, on the right you can see that they’re getting quite close for Ruby 2.7 prerelease - only around 5% slower, give or take.

What About Rack?

What should we expect for Rack? Well, if simpler is better for JITting, Rack should have better JIT-versus-not performance. That is, JIT should do relatively better compared to non-JIT by some amount in 2.7 than 2.6.

And that’s roughly what we see:

JIT is still slower than non-JIT, but it’s getting closer. These numbers are much higher because a raw Rack “hello, world” route is very fast compared to Rails.

JIT is still slower than non-JIT, but it’s getting closer. These numbers are much higher because a raw Rack “hello, world” route is very fast compared to Rails.

Conclusions

What you’re seeing above is pretty much what Takashi Kokubun said - while JIT is still slower on Rails (and Rack) than no JIT, the newer changes in 2.7 look promising… And JIT is catching up. We have around a year and a half before Ruby 3x3 is tentatively scheduled for release. This definitely looks like JIT could be a plus for Rails instead of a minus by then, but I wouldn’t expect it to be, say, 30% faster. But Takashi may prove me wrong!

Measuring Rails Overhead

We all know that using Ruby on Rails is slower than just plain Rack. After all, Rack is the simplest, most bare-bones web interface in Ruby, unless you’re willing to do without compatibility between app servers (or unless you’re writing your own.)

But how much overhead does Rails add? Is it getting less as Ruby gets faster?

I’m working with a new, simpler Rails benchmark lately. Let’s see what it can tell us on this topic.

Easy Does It

If we want to measure Rails overhead, let’s start simple - no concurrency (one thread, one process) and a simple Rails “hello, world”-style app, meaning a single route that returns a static string.

That’s pretty easy to measure in RSB. I’ll assume Puma is a solid choice of app server - not necessarily the best possible, but more representative than WEBrick. I’ll also use an Amazon EC2 m4.2xlarge dedicated instance. It’s my normal Rails Ruby Bench baseline, and a solid choice that a modestly successful Ruby startup would be likely to use. I’ll use Rails version 4.2 - not the newest or the best. But it’s the last version that’s still compatible with Ruby 2.0.0, which we need.

We’ll look at one of each Ruby minor version from 2.0 through 2.6. I like to start with Ruby 2.0.0p0 since it’s the baseline for Ruby 3x3. Here are throughputs that RSB gets for each of those versions:

RSB_StaticRouteSingleBG.png

That looks decent - from around 760 iters/second for Ruby 2.0 to around 1000 iters/second for Ruby 2.6. Keep in mind that this is a single-threaded benchmark, so the server is only using one core. You can get much faster numbers with more cores, but then it’s harder to tell exactly what’s going on. We’ll start simple.

Now: how much of that overhead is Ruby on Rails, versus the application server and so on? The easiest way to check that is to run a Rack “hello, world” application with the same configuration and compare it to the Rails app.

Here’s the speed for that:

RSB_RackStaticRouteSingleBG.png

Once again, not bad. You’ll notice that Rails is quite heavy here - the Rack-based app runs far faster. Rails is really not designed for “hello, world”-type applications, just as you’d expect. But we can do a simple mathematical trick to subtract out the Puma and Rack overhead and get just the Rails overhead:

iters_sec_formula.png

Then we can subtract the Puma and app server overhead from Rails. Here’s what that looks like when we do it once for each Ruby version.

RailsTimePerRequestBG.png

And now you can see how long Rails adds to the execution time of each route in your Rails application! You’ll notice the units are “usec”, or microseconds. So to round shamelessly, Rails adds around 1 millisecond (1/1000th of a second) to each request. The Rack requests above happened at more like 12,000/second, or around 83 usec per request — that’s added to the Rails time in the last graph, not subtracted from it.

Other Observations

When you measure, you usually get roughly what you were looking for - in this case, we answered the question, “how much time does Rails take for each request?” But you often get other interesting information as well.

In this case, we get some interesting data points on what gets faster with newer Ruby versions.

You may recall that Discourse, a big Rails app, running with high concurrency, gets about 72% faster from Ruby 2.0.0p0 to Ruby 2.6. Some of the numbers with OptCarrot show huge speedups, 400% and more in a few specific configurations.

The numbers above are less exciting, more in the neighborhood of 30% speedup. Heck, Rack gets only 16%. Why?

I’ll let you in on a secret - when I time with WEBrick instead of Puma, it gets 74% faster. And after that 74% speedup, it’s still slower than Puma.

Puma uses a reactor and the libev event library to spend most of its time in highly-tuned C code in system libraries. As a result, it’s quite fast. It also doesn’t really get faster when Ruby does — that’s not where it spends its time.

WEBrick can get much faster because it’s spending lots of time in Ruby… But only to approach Puma, not really to surpass it.

OptCarrot can do even better - it’s performance-intensive all-Ruby code, it’s processor-bound, and a lot of optimizations are aimed at exactly what it’s doing. So it can make huge gains - tripling its speed or more. You’ll also notice if you explore OptCarrot a bit that it’s harder to see those huge gains if it’s running in optimized mode. There’s just less fat to cut. That should make sense, intuitively.

And highly-tuned code that’s still basically Ruby, like the per-request Rails code, is in between. In this case, you’re seeing it gain around 30%, which is much better than nothing. In fact, it’s quite respectable as a gain to highly-tuned code written in a mature programming language. That 30% savings will save a lot of processor cycles for a lot of Rails users. It just doesn’t make a stunning headline.

Conclusions

We’ve checked Rails’ overhead: it’s around 900usec/request for modern Ruby.

We’ve checked how it’s improved: from about 1200 usec to 900 usec since Ruby 2.0.0p0.

And we’ve observed the range of improvement in Ruby code: glue code like Puma only gains around 16% from Ruby 2.0.0p0 to 2.6, because it barely spends any time in Ruby. Your C extensions aren’t going to magically get faster because they’re waiting on C, not Ruby. And it’s quite usual to get around 72%-74% on “all-Ruby” code, from Discourse to WEBrick. But only in rare CPU-heavy cases are you going to see OptCarrot-like gains of 400% or more… And even then, only if you’re running fairly un-optimized code.

Here’s one possible interpretation of that: optimization isn’t really to take your leanest, meanest, most carefully-tuned code and make it way better. Most optimization lets you write only-okay code and get closer to those lean-and-mean results without as much effort. It’s not about speeding up your already-fastest code - it’s about speeding you up in writing the other 95% of your code.

Using Machine Learning to Improve the Maintenance Experience for Residents

Introduction

Maintenance is a big part of a property manager’s (PM) job. It is an important service to residents and a great way to establish a positive relationship with them.

For PMs that use AppFolio, the typical workflow for a maintenance request is as follows. The resident identifies an issue and notifies their PM of it, either by calling them over the phone or submitting a service request through their online resident portal. The PM then assesses the urgency of the issue and chooses who to dispatch in order to fix it.

In this blog post, we focus on the case where the resident submits an issue through the online portal. When the resident submits a maintenance request through the portal the first thing they have to provide is a short description (950 characters max) of their issue. They then have to choose one of 23 categories for their issue. If no category is a good fit for their issue, they can choose the ‘Other’ category.

Assigning the right category to an issue is important because different categories have different guidelines, levels of urgency, and preferred vendors. Improving the accuracy of the categorization can reduce the number of errors and speed up issue handling, ultimately providing a better experience to the resident.

Choosing the right category may seem obvious, but it is actually not always that easy and we found that tenant choose the wrong category quite often. Our goal was to see if machine learning could help with the classification.

It did. In the rest of this post, we detail the approach that we followed, and how using machine learning led to interesting findings on the categories.

Text classification problem

We formulate this problem as a text classification task. A text classification problem consists in assigning a class to a document. A document can be a word, a sentence or a paragraph. We have more than 500,000 maintenance requests that we can use to train a supervised classifier.

Here’s an example of a maintenance request.

request example.png

Pre-processing

The first step is to turn the text into a numerical vector by applying “word embedding” so that our machine learning algorithm can make sense of the words. In order to have vectors of the same dimension for each of the vectors representing a description, we simply count the number of occurrences of each token, a technique called bag of words. To reduce the impact of common but not informative words, we apply tf-idf on the result of the bag of words.

NLP preprocessing.png

This is an example of how the pre-processing steps in our approach.

Classifier

To choose the classifier, we want a probabilistic model that can fit well to embedding. If the data is normally distributed, then a normal distribution is perfect to describe it. If the data is very sparse, a selective probability measure is a better choice. Applying bag of words embedding on a large corpus results in sparse matrix, so a selective distribution like logistic distribution will be a good fit.

So here is a summary of our baseline model: a bag-of-words feature extraction + tf-idf weighting + SGD Logistic classifier. This setup achieves an accuracy of 83%. Simple and yet a pretty good accuracy to start with!

Using more advanced methods in any steps above should improve our results. We tried the the following:

  1. Preprocessing: blacklist non-domain specific stop words, removing non-english requests.

  2. Embedding: pre-trained word2vec at different dimensions.

  3. Complicate model family: Tree based, boosting algorithm, 2-layers CNN…

But it didn’t improve on our baseline. Complex models like boosting and CNN even have a worse performance. We wanted to understand why and started digging into the data. We found the following problems, which we detail in the rest of the post:

  1. Traditional NLP problems: noise in data and labels.

  2. Variation in the resident’s intent when they submit a request: symptoms vs. cause vs. treatment.

  3. Out-of-box embedding won’t work, domain context is required

Noise in data and in labels

Multiple issues (noisy data)

A frequent source of errors was that the resident reported two issues at the same time. For example:

The issue: “There seems to have been some property damage from the high winds over the past few days. Dozens of shingles have blown off the roof, and 3 sections of the privacy fence have blown down. Not just the fence panels, but at least 3 of the posts have broken.” actually includes two issues: “fence_or_gate_damaged” and “roof_missing_shingles”.

We formulated that as a separate binary classification problem and changed the UI of the resident portal to try and dissuade the resident from reporting multiple issues. The results of this classification are out of scope for this post.

Contradicting labels (noisy labels)

Below are the labels that residents chose when the description of their issue simply said “Plumbing”.

contradicting labels.png

It shows that requesters have different opinions to “Plumbing” due to their own knowledge, or that their description of the issue was too generic. The example will confuse the model at every occurrence of the word “plumbing”. For a meta-algorithm like boosting, this “wrong” label will be emphasized.

Reporting symptom vs. cause vs. treatment

Symptom vs. cause

By looking at confusion matrix, we can see that errors mainly came from several misclassification pairs.

confusion matrix.png

These pairs include

confusing pairs.png

There is a mix of cause and symptom on what we try to predict. The request “my room is dark and I’m pretty sure it’s not the light bulb issues because I bought the light bulb yesterday.” can be classified as “electricity_off” because the tenant is answering the cause of the problem. The causal chain can keep extending: appliances_broken could lead to drain_clogged, which could further lead to toilet_wont_flush. Depending on her knowledge, the resident may report any of the three issues.

We can’t say any of them is nonsense, but which helps us solve the problem? Can we find an expert capable of fixing all these issues? If not, can we ask the resident to describe the problem and infer the cause separately?

Treatment

Additionally to the cause and the symptom of the issue, the description may also contain some treatment information.

Requesters often have the least knowledge about what the treatment could be (otherwise they could fix the issue themselves). When asked to describe the issue, chances are they guess a vague and sometimes misleading treatment. Consider the request earlier about the garage lights not working. The resident gave the hypothetical reason and the treatment. This may increase the chance that issue gets predicted as “electricity_off”.

Mixing the symptoms, treatment, and cause of an issue will result in different ways of reporting the same issue, which will confuse the classifier.

three branches.png

The problem with out-of-the-box embedding

Pretrained Word2Vec MCC examples

Pretrained Word2Vec MCC examples

Maaten, L.V., &amp; Hinton, G.E. (2008). Visualizing Data using t-SNE.

Maaten, L.V., & Hinton, G.E. (2008). Visualizing Data using t-SNE.

We mentioned word2vec for embedding is usually a good way to improve performance in NLP problems. It didn’t work in our case.

The first image shows a 2D t-SNE projection of 100-D word2vec vectors, a state-of-art word embedding models. Each colored number is a maintenance request’s class ranging from 1 to 23. Each request embedding is a tf-idf weighted summation of pre-trained word2vec word embedding. Unlike the t-SNE visualization of learned features in the MNIST dataset (2nd figure), the clusters are not obvious, meaning that our classifier has to fit very hard to the skewed boundary. To some gaussian based classifiers, it’s almost impossible. The only thing obvious is pre-trained word2vec is not sufficient.

Improvement

Our error analysis has shown that our ground truth data is quite noisy (multiple issues, multiple labels for the same description, etc.). This leads to a lower perceived performance of the model than what it can really be in reality. Indeed, if someone writes “Plumbing” and the classifier chooses ‘pipe_leaking’ rather than “toilet_wont_flush”, is that truly an error? Probably not. Similarly, if a user mentions two issues belonging to multiple categories in a single description and the classifier picks the category corresponding to one of the issues but the resident picks the other one, this shouldn’t be considered as an error.

To assess the true performance of the model, we created a hand-labeled benchmark. We also learned that using out-of-the-box embeddings doesn’t work as well in our given context. We explore how to put domain context into embeddings with a superior language understanding algorithm, BERT

Creating a benchmark to assess the true performance or our model

We randomly selected 200 examples where the classifier made the wrong recommendation despite having an 80% or higher confidence rate. All examples in this benchmark were relabeled by the team. Following are two examples where our labels matched the model’s prediction.

corrected prediction.png

When considering our manual labels as the truth (as opposed to what the tenant chose in reality) the baseline classifier achieves over 87% of accuracy on these 200 examples. There are two main reasons for this: first, the tenant just seems to have picked something random, and the classifier actually is better at choosing the right category. Second, both the tenant and the classifier were right, there were just multiple issues. In this last case, we considered that the classifier was right and didn’t count this as a classification error.

Assuming this benchmark is representative of the whole dataset, this means that an 87% accuracy of what we thought were failed predictions is now right. Remember that our accuracy rate was 85% so the adjusted accuracy is actually 85 + 0.87*15 = 98.5%.

In practice, we can adjust the confidence threshold to where we can safely handover the categorization to the model, and fall back to human categorization for lower confidence predictions. That is huge, because over 40% of our predictions has at least 80% of confidence. If a 5% error rate is acceptable, then we save almost half of the human categorization effort!

error rate to confidence level

error rate to confidence level

Adding domain context into embedding with superior language understanding

Long term, we also want to clarify what each category means and possibly remove some and add some others to better match the real use cases.

In the extracted dataset, one third of the issues are categorized as “Other”. The “Other” category cannot have specific vendors and instructions and is therefore more time-consuming for property managers to handle. Finding new specialized categories is therefore valuable. We can find the new categories by clustering the issues.

We applied an agglomerative base hierarchical clustering algorithm on BERT-Base, Uncased embedding. The algorithm uses bottom-up approach to minimize the increased inter-cluster variance during agglomeration.

We tried lowering the number of clusters from 100 to 10 and see what clusters emerged consistently. Here we witness the power of good embedding again. Before fine-tuning, clustering result with the out-of-box embedding is long-tailed. The largest category consists of 1106 out of 10K examples we clustered. After fine-tuning, the largest population cut down to 289 examples. What’s more, the largest cluster is meaningful too.

Below are the top 3 issues we discovered. We tagged each cluster by top tf-idf keywords to summarize the cluster.

clustering unknown.png

‘Stove in my room it’s not good. Can you change please? Monday and Tuesday you can come to do it thanks’,

‘Stove handle broke off. Need new window shade for the front living room.’,

‘The garbage disposal shoots up throught the other side of the sink. The furnace has yet to be fixed and it continues to go out frequently ‘,

Other categories we discovered includes outlet not working, lease agreement, mailbox key lost, unpaid rent, loud music or appliance noise, snow, and roaches.

Issues reported in Cluster 1 are very close to an existing category (“door_wont_lock”). Why did residents not choose “door_wont_lock”? This is unclear, but the most likely explanation is that the resident may not have seen the issue or didn’t bother to read all 23 categories and just selected “Other” instead. The fact that existing categories are at the top of issues in the uncategorized issue implies that we could potentially break the current labeling. If an existing category is relevant it will still emerge as a significant cluster.

With this approach, new label is data-driven and therefore free from human subjective. As long as we have enough data, we can confidently believe future requests won’t be too surprising to be categorized correctly.

Such impressive clustering is possible thanks to BERT. BERT learned the context by fine-tuning a few last layers of its complicated network to a domain specific task, while fixing the rest of network as it was. We particularly fine tuned the BERT model on previous single issue classification task. Using the smallest pretrained network BERT-Base, Uncased, which has 12-layer, 768-hidden, 12-heads, 110M parameters. Thanks to the Transformer’s nature, which BERT architecture based on, it can learn long range inter-words relationships, but also makes training more expensive. With fine-tuning we can leverage the massive pretrained network with only 6hr training on ml.p3.2xlarge AWS instance.

BERT also did well on the original classification task. Compared with SGD on the benchmark, BERT has more predictions exactly the same as requester’s label. In fact, BERT’s prediction is 50% more aligned with user’s label and 30% more correct than SGD. Two cases are illustrated below respectively.

BERT performance.png

Conclusion

NLP can be very valuable in solving the real world of assigning a category to a maintenance request submitted by a resident. A simple approach yielded a decent 83% classification accuracy.

This is especially good in the light of the noise in the data, which is a normal problem in real world problems. Assessing the performance on a hand-labeled subset of the data showed that the true accuracy would be 98.5%.

Some of the noise could be mitigated going forward through a better user interface (multiple issues) or a redesign of the categories. However, some of the noise seems hard to control for because it depends on the user’s knowledge and way of reporting an issue (cause vs. symptom vs. treatment).

Using BERT could further improve the classification accuracy. BERT is also useful to discover new categories which could contribute to reducing the amount ‘Other’ issue.

If you find this type of work interesting, come and join our team we are hiring!

A Simpler Rails Benchmark, Puma and Concurrency

I’ve been working on a simpler Rails benchmark for Ruby, which I’m calling RSB, for awhile here. I’m very happy with how it’s shaping up. Based on Rails Ruby Bench, I’m guessing it’ll take quite some time before I feel like it’s done, but I’m finding some interesting things with it. And isn’t that what’s important?

Here’s an interesting thing: not every Rails app is equal when it comes to concurrency and threading - not every Rails app wants the same number of threads per process. And it’s not a tiny, subtle difference. It can be quite dramatic.

(Just want to see the graphs? I love graphs. You can scroll down and skip all the explanation. I’m cool with that.)

New Hotness, Old and Busted

You’ll get some real blog posts on RSB soon, but for this week I’m just benchmarking more "Hello, World” routes and measuring Rails overhead. You can think of it as me measuring the “Rails performance tax” - how much it costs you just to use Ruby on Rails for each request your app handles. We know it’s not free, so it’s good to measure how fast it is - and how fast that’s changing as we approach Ruby 3x3 and (we hope) 3x the performance of Ruby 2.0.

For background here, Nate Berkopec, the current reigning expert on speeding up your Rails app, starts with a recommendation of 5 threads/process for most Rails apps.

You may remember that with Rails Ruby Bench, based on the large, complicated Discourse forum software, a large EC2 instance should be run with a lot of processes and threads for maximum throughput (latency is a different question.) There’s a diminishing returns thing happening, but overall RRB benefits from about 10 processes with 6 threads per process (for a total of 60 threads.) Does that seem like a lot to you? It seems like a lot to me.

I’m gonna show you some graphs in a minute, but it turns out that RSB (the new simpler benchmark) actually loses speed if you add very many threads. It very clearly does not benefit from 6 threads per process, and it’s not clear that even 3 is a good idea. With one process and four threads, it is not quite as fast as one process with only one thread.

A Quick Digression on Ruby Threads

So here’s the interesting thing about Ruby threads: CRuby, aka “Matz’s Ruby,” aka MRI has a Global Interpreter Lock, often called the GIL. You’ll see the same idea referred to as a Global VM Lock or GVL in other languages - it’s the same thing.

This means that two different threads in the same process cannot be executing Ruby code at the same time. You have to hold the lock to execute Ruby code, and only one thread in a process can hold the lock at a time.

So then, why would you bother with threads?

The answer is about when your thread does not hold the lock.

Your thread does not hold the lock when it’s waiting for a result from the database. It does not hold the lock when sleeping, waiting on another process finishing, waiting on network I/O, garbage collecting in a background thread, running code in a native (C) extension, waiting for Redis or otherwise not executing Ruby code.

There’s a lot of that in a typical Rails app. The slow part of a well-written Rails app is waiting for network requests, waiting for the database, waiting for C-based libraries like libXML or JSON native extensions, waiting for the user…

Which means threads are useful to a well-written Rails app, even with the GIL, up to around 5 threads per process or so. Potentially it can be even more than 5 — for RRB, 6 is what looked best when I first measured.

But Then, Why…?

Here’s the thing about RSB. It’s a “hello, world” app. It doesn’t use Redis. It doesn’t even use the database. And so it’s doing only a little bit where CRuby threads help, because of the GIL. Only a little HTTP parsing. No JSON or XML parsing.

Puma does a little more that can be parallelized, which is why threads help at all, even a little.

So: Discourse is near the high end of how many threads help your Rails app at around 6. But RSB is just about the lowest possible (2 is often too many.)

Okay. Is that enough conceptual and theoretical? I feel like that’s plenty of conceptual and theoretical. Let’s see some graphs!

Collecting Data

I’ve teased about finding some things out. So what did I do? First off, I picked some settings for RSB and ran them. And in the best traditions of data collection, I discovered a few useful things and a few useless things. Here’s the brief, cryptic version… Followed by some explanation:

multiversion_puma_concurrency.png

Clear as mud, right?

The dots in the left column are for Ruby 2.0.0, then Ruby 2.1.10, 2.2.10, etc., until the rightmost dots are all Ruby 2.6. See how the dots get bigger and redder? That’s to indicate higher throughput — the throughputs are in HTTP requests/second, and are also in text on each dot. Each vertical column of dots uses the same Ruby version.

Each horizontal row of dots uses the same concurrency settings - the same number of processes and threads. You can see a key to how many of each over on the left.

What can we conclude?

First, the dots get bigger from left to right in each row, so Ruby versions gets faster. The “Rails performance tax” gets significantly lower with higher Ruby versions, because they’re faster. That’s good.

Also: newer Ruby versions get faster at about the same rate for each concurrency setting. To say more plainly: different Ruby versions don’t help much more or less with more processes or threads. No matter how many processes or threads, Ruby 2.6.0 is in the general neighborhood of 30% faster than Ruby 2.0.0 - it isn’t 10% faster with one thread and 70% faster with lots of threads, for instance.

(That’s good, because we can measure concurrency experiments for Ruby 2.6 and they’ll mostly be true for 2.0.0 as well. Which saves me many hours on some of my benchmark runs, so that’s nice.)

Now let’s look at some weirder results from that graph. I thought the dots would be clearer for the broad overview. But for the close-in, let’s go back to nice, simple bar graphs.

Weirder Results

Let’s check out the top two rows as bars. Here they are:

The Ruby versions go 2.0 to 2.6, left to right.

The Ruby versions go 2.0 to 2.6, left to right.

What’s weird about that? Well, for starters, 1 process with four threads is less than one-fourth of the speed of 4 processes with one thread. If you’re running single-process, that kinda sounds like “don’t bother with threads.”

(If you already read the long-winded explanation above you know it’s not that simple, and it’s because RSB threads really poorly in an environment with a Global Interpreter Lock. If you didn’t — it’s a benchmark! Feel free to quote this article out of context anywhere you like, as long as you link back here :-) )

Here’s that same idea with another pair of rows:

Kinda looks like “just save your threads and stay home,” doesn’t it?

Kinda looks like “just save your threads and stay home,” doesn’t it?

It tells the same story even more clearly, I think. But wait! Let’s look at 8 processes.

The Triumphant hero shot: a case where 4 threads are… well, maybe marginally better than 1. Barely. Also, this was the final graph. You can CMD-W any time from here on out.

The Triumphant hero shot: a case where 4 threads are… well, maybe marginally better than 1. Barely.
Also, this was the final graph. You can CMD-W any time from here on out.

That’s a case where 4 threads per process give about a 10% improvement over just one. That’s only noteworthy because… well, because with fewer processes they did more harm than good. I think what you’re seeing here is that with 8 processes, you’re finally seeing enough not-in-Ruby I/O and context switching that there’s something for the extra threads to do. So in this case, it’s really all about the Puma configuration.

I am not saying that more threads never help. Remember, they did with Rails Ruby Bench! And in fact, I’m looking forward to finding out what these numbers look like when I benchmark a Rails route with some real calculation in it (probably even worse) or a few quick database accesses (probably much better.)

You might reasonably ask, “why is Ruby 2.6 only 30% faster than Ruby 2.0?” I’m still working on that question. But I suspect part of the answer is that Puma, which is effectively a lot of what I’m speed-testing, uses a lot of C code, and a lot of heavily-tuned code that may not benefit as much from various Ruby optimizations… It’s also possible that I’m doing something wrong in measuring. I plan to continue working on it.

How Do I Measure?

First off, this is new benchmark code. And I’m definitely still shaking out bugs and adding features, no question. I’m just sharing interesting results while I do it.

But! The short version is that I set up a nice environment for testing with a script - it runs the trials in a randomized order, which helps to reduce some kinds of sampling error from transient noise. I use a load-tester called wrk, which is recommended by the Phusion folks and generally quite good - I examined a number of load testers, and it’s been by far my favorite.

I’m running on an m4.2xlarge dedicated EC2 instance, and generally using my same techniques from Rails Ruby Bench where they make sense — a very similar data format, for instance, to reuse most of my data processing code, and careful tagging of environment variables and benchmark settings so I don’t get them confused. I’m also recording error rates and variance (which effectively includes standard deviation) for all my measurements - that’s often a way to find out that I’ve made a mistake in setting up my experiments.

It’s too early to say “no mistakes,” always. But I can set up the code to catch mistakes I know I can make.

I’d love for you to look over the benchmark code and the data and visualizations I’m using.

Conclusions

It’s tempting to draw broad conclusions from narrow data - though do keep in mind that this is pretty new benchmark code, and there could be flat-out mistakes lurking here.

However, here’s a pretty safe conclusion:

Just because “most Rails apps” benefit from around five threads/process doesn’t mean your Rails or Ruby app will. If you’re mostly just calculating in Ruby, you may want significantly fewer. If you’re doing a lot of matching up database and network results, you may benefit from significantly more.

And you can look forward to a lot more work on this benchmark in days to come. I don’t always publicize my screwed up dubious-quality results much… But as time marches forward, RSB will keep teaching me new things and I’ll share them. Rails Ruby Bench certainly has!

WRK It! My Experiences Load-Testing with an Interesting New Tool

There are a number of load-testers out there. ApacheBench, aka AB, is probably the best known, though it’s pretty wildly inaccurate and not recommended these days.

I’m going to skim quickly over the tools I didn’t use, then describe some interesting quirks of wrk, good and bad.

Various Other Entrants

There are a lot of load-testing tools and I’ll mention a couple briefly, and why I didn’t choose them.

For background, “ephemeral port exhaustion” is what happens when a load tester keeps opening up new local sockets until all the ephemeral range are gone. It’s bad and it prevents long load tests. That will become relevant in a minute.

Siege uses a cute dog logo, though.

Siege uses a cute dog logo, though.

ApacheBench, as mentioned above, is all-around bad. Buggy, inexact, hard to use. I wrote a whole blog post about why to skip it, and I’m not the only one to notice. Nope.

Siege isn’t bad… But it automatically reopens sockets and has unexplained comments saying not to use keepalive. So a long and/or concurrent and/or fast load test is going to hit ephemeral port exhaustion very rapidly. Also, siege doesn’t have an easy way to dump higher-resolution request data, just the single throughput rate. Nope.

JMeter has the same problem in its default configuration, though you can ask it not to. But I’m using this from the command line and/or from Ruby. There’s a gem to make this less horrible, but the experience is still quite bad - JMeter’s not particularly command-line friendly. And it’s really not easy to script if you’re not using Java. Next.

Locust is a nice low-overhead testing tool, and it has a fair bit of charm. Unfortunately, it really wants to be driven from a web console, and to run across many nodes and/or processes, and to do a slow speedup on start. For my command-line-driven use case where I want a nice linear number of load-test connections, it just wasn’t the right fit.

This isn’t anything like all the available load-testing tools. But those are the ones I looked into pretty seriously… before I chose wrk instead.

Good and Bad Points of Wrk

Nearly every tool has something good going for it. Every tool has problems. What are wrk’s?

First, the annoying bits:

1) wrk isn’t pre-packaged by nearly anybody - no common Linux or Mac packages, even. So wherever you want to use it, you’ll need to build it. The dependencies are simple, but you have to.

2) like most load-testers, wrk doesn’t make it terribly easy to get the raw data out of it. In wrk’s case, that means writing a lua dumper script that runs in quadratic time. Not the end of the world, but… why do people assume you don’t want raw data from your load test tool? Wrk isn’t alone in this - it’s shockingly difficult to get the same data at full precision out of ApacheBench, for instance.

3) I’m really not sure how to pronounce it. Just as “work?” But how do I make it clear? I sometimes write wg/wrk, which isn’t better.

And now the pluses:

1) low-overhead. Wrk and Locust consistently showed very low overhead when running. In wrk’s case it’s due to its… charmingly quirky concurrency model, which I’ll discuss below. Nonetheless, wrk is both fast and consistent once you have it doing the right thing.

2) reasonably configurable. The lua scripting isn’t my 100% favorite in every way, but it’s a nice solid choice and it works. You can get wrk to do most things you want without too much trouble.

3) simple source code. Okay, I’m an old C guy so maybe I’m biased. But work has short, punchy code that does the simple thing in a mostly obvious way. The two exceptions are two packaged-in dependencies - an http header parser which is fast but verbose, and an event-model library torn out of a Tcl implementation. But if you’re curious how wrk opens a socket, reads data or similar, you can skip the ApacheBench-style reading of a giant library of nonstandard network operations in favor of short, simple and Unixy calls to the normal stuff. As C programs go, wrk is an absolute joy to read.

And Then, the Weird Bits

A load-tester normally has some simple settings. It can let you specify how many requests to run for. Or how many seconds (like wrk does.) Or both, which is nice. It can take a URL, and often options like keepalive (wrk’s keepalive specifically could use some work.)

And, of course, concurrency. ApacheBench’s simple “concurrency” option is just how many connections to use. Another tool might call this “threads” or “workers.”

Wrk, on the other hand has connections and threads and doesn’t really explain what it does with them. After significant inspection of the source, I now know - and I’ll explain it to you.

Remember that event library thing that wrk builds in as a dependency? If you read the code, it’s a little reactor that keeps track of a bunch of connections, including things like timeouts and reconnections.

A Slide from my RubyKaigi talk - wrk was used to collect the data.

A Slide from my RubyKaigi talk - wrk was used to collect the data.

Each thread you give wrk gets its own reactor. The connections are divided up between them, and if the number of threads doesn’t exactly divide the number of connections (example: 3 threads, 14 connections) then the spare connections are just left unused.

All of those connections can be “in flight” at once - you can potentially have every connection open to your specified URL, even with only a single thread. That’s because a reactor can handle as many connections as it has processor power available, not only one at once.

So wrk’s connections are roughly equivalent to ApacheBench’s concurrency, but its threads are a measure of how many OS threads you want processing the result. For a “normal” evented library, something like Node.js or EventMachine, the answer tends to be “just one, thanks.”

This caused the JRuby team and me (independently) a noticeable bit of headache, so I thought I’d mention it to you.

So, Just Use Wrk?

I lean toward saying “yes.” That’s the recommendation from Phusion, the folks who make Passenger. And I suspect it’s not a coincidence that the JRuby team and I independently chose wrk at the same time - most load testing tools aren’t good, and ephemeral port exhaustion is a frequent problem. Wrk is pretty good, and most just aren’t.

On the other hand, the JRuby team and I also found serious performance problems with Puma and Keepalive as a result of using a tool that barely supports turning it off at all. We also had some significant misunderstandings of what “threads” versus “connections” meant, though you won’t have that problem. And for Rails Ruby Bench I did what most people do and built my own, and it’s basically never given me any trouble.

So instead I’ll say: if you’re going to use an off-the-shelf load tester at all, Wrk is a solid choice, though JMeter and Locust are worth considering if they match your use case. A good off-the-shelf tester can have much lower overhead than a tester you built in Ruby, and be more powerful and flexible than a home-rolled one in C.

But if you just build your own, you’re still in very good company.

Learn by Benchmarking Ruby App Servers Badly

(Hey! I usually post about learning important, quotable things about Ruby configuration and performance. THIS POST IS DIFFERENT, in that it is LESSONS LEARNED FROM DOING THIS BADLY. Please take these graphs with a large grain of salt, even though there are some VERY USEFUL THINGS HERE IF YOU’RE LEARNING TO BENCHMARK. But the title isn’t actually a joke - these aren’t great results.)

What’s a Ruby App Server? You might use Unicorn or Thin, Passenger or Puma. You might even use WEBrick, Ruby’s built-in application server. The application server parses HTTP requests into Rack, Ruby’s favored web interface. It also runs multiple processes or threads for your app, if you use them.

Usually I write about Rails Ruby Bench. Unfortunately, a big Rails app with slow requests doesn’t show much difference between the app servers - that’s just not where the time gets spent. Every app server is tolerably fast, and if you’re running a big chunky request behind it, you don’t need more than “tolerably fast.” Why would you?

But if you’re running small, fast requests, then the differences in app servers can really shine. I’m writing a new benchmark so this is a great time to look at that. Spoiler: I’m going to discover that the load-tester I’m using, ApacheBench, is so badly behaved that most of my results are very low-precision and don’t tell us much. You can expect a better post later when it all works. In the mean time, I’ll get some rough results and show something interesting about Passenger’s free version.

For now, I’m still using “Hello, World”-style requests, like last time.

Waits and Measures

I’m using ApacheBench to take these measurements - it’s a common load-tester used for simple benchmarking. It’s also, as I observed last time, not terribly exact.

For all the measurements below I’m running 10,000 requests against a running server using ApacheBench. This set is all with concurrency 1 — that is, ApacheBench runs each request, then makes another one only after the first one has returned completely. We’ll talk more about that in a later section.

I’m checking not only each app server against the others, but also all of them by Ruby version — checking Ruby version speed is kinda my thing, you know?

So: first, let’s look at the big graph. I love big graphs - that’s also kinda my thing.

You can click to enlarge the image, but it’s still pretty visually busy.

What are we seeing here?

Quick Interpretations

Each little cluster of five bars is a specific Ruby version running a “hello, world” tiny Rails app. The speed is averaged from six runs of 10k HTTP requests. The five different-colored bars are for (in order) WEBrick (green), Passenger (gray), Unicorn (blue), Puma (orange) and Thin (red). Is it just me, or is Thin way faster than you’d expect, given how little we hear about it?

The first thing I see is an overall up-and-to-the-right trend. Yay! That means that later Ruby versions are faster. If that weren’t true, I would be sad.

The next thing I see is relatively small differences across this range. That makes some sense - a tiny Rails app returning a static string probably won’t get much speed advantage out of most optimizations. Eyeballing the graph, I’m seeing something around 25%-40% speedup. Given how inaccurate ApacheBench’s result format is, that’s as nearly exact as I’d care to speculate from this data (I’ll be trying out some load-testers other than ApacheBench in future posts.)

(Is +25% really “relatively small” as a speedup for a mature language? Compared to the OptCarrot or Rails Ruby Bench results it is! Ruby 2.6 is a lot faster than 2.0 by most measures. And remember, we want three times as fast, or +200%, for Ruby 3x3.)

I’m also seeing a significant difference between the fastest and slowest app servers. From this graph, I’d say in order the fastest are Puma, Thin and Passenger, in that order, at the front of the pack. The two slower servers are Unicorn and WEBrick - though both put in a pretty respectable showing at around 70% of the fastest speeds. For fairly short requests like this, the app server makes a big difference - but not “ridiculously massive,” just “big."

But Is Rack Even Faster?

In Ruby, a Rack “Hello, World” app is the fastest most web apps get. You can do better in a systems language like Java, but Ruby isn’t built for as much speed. So: what does the graph look like for the fastest apps in Ruby? How fast is each app server?

Here’s what that graph looks like.

RackSimpleAppThroughput.png

What I see there: this is fast enough that ApacheBench’s output format is sabotaging all accuracy. I won’t speculate exactly how much faster these are — that would be a bad idea. But we’re seeing the same patterns as above, emphasized even more — Puma is several times faster than WEBrick here, for instance. I’ll need to use a different load-tester with better accuracy to find out just how much faster (watch this space for updates!)

Single File Isn’t the Only Way

Okay. So, this is pretty okay. Pretty graphs are nice. But raw single-request speed isn’t the only reason to run a particular web server. What about that “concurrency” thing that’s supposed to be one of the three pillars of Ruby 3x3?

Let’s test that.

Let’s start with just turning up the concurrency on ApacheBench. That’s pretty easy - you can just pass “-c 3” to keep three requests going at once, for instance. We’ve seen the equivalent of “-c 1” above. What does “-c 2” look like for Rails?

Here:

Screen Shot 2019-01-22 at 10.05.12 AM.png

That’s interesting. The gray bars are Passenger, which seems to benefit the most from more concurrency. And of course, the precision still isn’t good, because it’s still ApacheBench.

What if we turn up the concurrency a bit more? Say, to six?

Screen Shot 2019-01-22 at 10.06.32 AM.png


The precision-loss is really visible on the low end. Also, Passenger is still doing incredibly well, so much so that you can see it even at this precision.

Comments and Caveats

There are a lot of good reasons for asterisks here. First off, let’s talk about why Passenger benefits from concurrency so much: a combination of running multiprocess by default and built-in caching. That’s not cheating - you’ll get the same benefit if you just run it out of the box with no config like I did here. But it’s also not comparing apples to apples with other un-configured servers. If I built out a little NGinX config and did caching for the other app servers, or if I manually turned off caching for Passenger, you’d see more similar results. I’ll do that work eventually after I switch off of ApacheBench.

Also, something has to be wrong in my Puma config here. While Puma and Thin get some advantage from higher concurrency, it’s not a large advantage. And I’ve measured a much bigger benefit for that before using Puma, in my RRB testing. I could speculate on why Puma didn’t do better, but instead I’m going to get a better load-tester and then debug properly. Expect more blog posts when it happens.

I hadn’t found Passenger’s guide to benchmarking before now - but kudos to them, they actually specifically try to shoo people away from ApacheBench for the same reasons I experienced. Well done, Phusion. I’ll check out their recommended load tester along with the other promising-looking ones (Ruby-JMeter, Locust, hand-rolled.)

Conclusions

Here’s something I’ve seen before, but had trouble putting words to: if you’re going to barely configure something, set it up and hope it works, you should probably use Passenger. That used to mean a bit more setup because of the extra Passenger/Apache setup or Passenger/NGinX setup. But at this point, Passenger standalone is fairly painless (normal gem-based setup plus a few Linux packages.) And as the benchmarks above show, a brainless “do almost nothing” setup favors Passenger very heavily, because the other app servers tend to need more configuration.

I’m surprised that Puma did so poorly, and I’ll look into why. I’ve always thought Passenger was a great recommendation for SREs that aren’t Ruby specialists, and this is one more piece of evidence in that direction. But Puma should still be showing up better than it did here, which suggests some kind of misconfiguration on my part - Puma uses multiple threads by default, and should scale decently.

That’s not saying that Passenger’s not a good production app server. It absolutely is. But I’ll be upgrading my load-tester and gathering more evidence before I put numbers to that assertion :-)

But the primary conclusion in all of this is simple: ApacheBench isn’t a great benchmarking program, and you should use something else instead. In two weeks, I’ll be back with a new benchmarking run using a better benchmarking tool.

Rails Ruby Bench Speed Roundup, 2.0 Through 2.6

Back in 2017, I gave a RubyKaigi talk tracing Ruby’s performance on Rails Ruby Bench up to that point. I’m still pretty proud of that talk!

But I haven’t kept the information up to date, and there was never a simple go-to blog post with the same information. So let’s give the (for now) current roundup - how well do all the various Rubies do at big concurrent Rails performance? How far has performance come in the last few years?

Plus, this now exists where I can link to it 😀

How I Measure

My primary M.O. has been pretty similar for a couple of years. I run Rails Ruby Bench, a big concurrent Rails benchmark based on Discourse, commonly-deployed open-source forum software that uses Rails. I run 10 processes and 60 threads on an Amazon EC2 m4.2xlarge dedicated instance, then seen how fast I can run a lot of pseudorandom generated HTTP requests through it. This is basically the same as most results you’ve seen on this blog. It’s also what you’ll see in the RubyKaigi talk above if you watch it.

For this post, I’m going to give everything in throughputs - that is, how many requests/second the test gives overall. I’m giving them in two graphs - measured against Discourse 1.5 for older Ruby, and measured against Discourse 1.8 for newer Ruby. One of the problems with macrobenchmarks is that there are basically always compatibility issues - old Discourse won’t work with newer Ruby, 1.8 works with most Rubies but is starting to show its age, and beyond 2.6 it’s really time for me to start measuring against even newer Discourse — which is why you’re getting this post, since it will be hard to compare Rubies side-by-side and it’s useful to have an “up to now” record. Plus I have awhile until Ruby 2.7, so this gives me extra time to get it all working 😊

The new data here - everything based on Discourse 1.8 - is based on 30 batches/Ruby of 30,000 HTTP requests per batch. For the Ruby versions I ran, the whole thing takes in the neighborhood of 12 hours. The older Discourse 1.5 data is much coarser, with 20 batches of 3,000 HTTP requests per Ruby version. My standards have come up a fair bit in the last two years?

Older Discourse, Older Ruby

First off, what did we see when measuring with the older Discourse version? This was in the RubyKaigi talk, so let’s look at that data. Here’s a graph showing the measured throughputs.

That’s a decent increase between 2.0.0 and 2.3.4.

That’s a decent increase between 2.0.0 and 2.3.4.

And here’s a table with the data.

Ruby VersionThroughput (reqs/sec)Speed vs 2.0.0
2.0.0127.6100%
2.1.10168.3132%
2.2.7187.7147%
2.3.4190.3149%

So that’s about a 49% speed increase from Ruby 2.0.0 to 2.3.4 — keeping in mind that you can’t perfectly capture “Ruby version X is Y% faster than version Z.” It’s always a somewhat complicated approximation, for a specific use case.

Newer Numbers

Those numbers were measured with Discourse 1.5, which worked from about Ruby 2.0 to 2.3. But for newer Rubies, I switched to at-the-time-new Discourse 1.8… which had slower HTTP processing, at least for my test. That’s fine. It’s a benchmark, not optimizing a use case for a real business. But it’s important to check how much slower or we can’t compare newer Rubies to older ones. Luckily, Ruby 2.3.4 will run both Discourse 1.5 and 1.8, so we can compare the two.

One thing I have learned repeatedly: running the same test on two different pieces of hardware, even very similar ones (e.g. two different m4.2xlarge dedicated EC2 instances) will give noticeably different results. I’m often checking 10%, 5% or 1% speed differences. I can’t save old results and check against new results on a new instance. Different EC2 instances frequently vary by 1% or more between them, even freshly spun-up. So instead I grab a new instance and re-run the results with the new variables thrown in.

For example, this time I re-ran all the Discourse 1.8 results, everything from Ruby 2.3.4 up to 2.6.0, on a new instance. I also checked a few intermediate Ruby versions, not just the highest current micro version for each minor version - it’s not guaranteed that speed won’t change across a minor version (e.g. Ruby 2.3.X or Ruby 2.5.X) even though that’s usually basically true.

That also let me unify a lot of little individual blog posts that are hard to understand as a group (for me too, not just for you!) It’s always better to run everything all at once, to make sure everything is compared side-by-side. Multiple results over months or years have too many small things that can change - OS and software versions, Ruby commits and patches, network conditions and hardware available…

So: this was one huge run of all the recent Ruby versions on the same disk image, OS, hardware and so on. Each Ruby version is different from the others, of course.

Newer Graphs

Let’s look at that newer data and see what there is to see about it:

Yeah, it’s in a different color scheme. Sorry.

Yeah, it’s in a different color scheme. Sorry.

Up and to the right, that’s nice. Here’s the same data in table form:

Ruby VersionThroughput (reqs/sec)Variance in ThroughputSpeed vs 2.3.4
2.3.4158.30.6100.0%
2.4.0164.31.1103.8%
2.4.1164.11.5103.7%
2.5.0175.10.8110.6%
2.5.3174.41.4110.2%
2.6.0182.30.8115.2%

You can see that the baseline throughput for 2.3.4 is lower - it’s dropped from 190.3 reqs/sec to 158.3 — in the neighborhood of a 20% drop in speed, solely due to Discourse version. I’m assuming the same ratio is true for comparing Discourse 1.8 and 1.5 since we can’t directly compare new Rubies on 1.5 or old Rubies on 1.8 without patching the code pretty extensively.

You can also see tiny drops in speed from 2.4.0 to 2.4.1 and 2.5.0 to 2.5.3 - they’re well within the margin of error, given the variance you see there. It’s nice to see that they’re so close, given how often I assume that every micro version within a minor version is about the same speed!

I’m seeing a surprising speedup between Ruby 2.5 and 2.6 - I didn’t find a significant speedup when I measured before, and here it’s around 5%. But I’ve run this benchmark more than once and seen the result. I’m not sure what changed - I’m using the same Git tag for 2.6 that I have been[1]. So: not sure what’s different, but 2.6 is showing up as distinguishably faster in these tests - you can check the variances above to roughly estimate statistical significance (and/or email me or check the repo for raw data.)

If you’d like an easier-to-read graph, I have a version where I chopped the Y axis higher up, not at zero - it would be misleading for me to show that one first, but it’s better for eyeballing the differences:

Note that the Y axis starts at 140 - this is to check details, NOT get a reasonable overview.

Note that the Y axis starts at 140 - this is to check details, NOT get a reasonable overview.

Conclusions

If we assume we get a 49% speedup from Ruby 2.0.0 to 2.3.4 (see the Discourse 1.5 graph) and then multiply the speedups (they don’t directly add and subtract,) here’s what I’d say for “how fast is RRB for each Ruby?” based on most recent results:

Ruby VersionSpeed vs 2.0.0
2.0.0100%
2.1.10132%
2.2.7147%
2.3.4149%
2.4.0155%
2.4.1155%
2.5.0165%
2.5.3164%
2.6.0172%

For 2.6.1 and 2.6.2, I don’t see any patches that would cause it to be different from 2.6.0. That’s what I’ve seen in early testing as well. I think this is about how fast 2.6.X is going to stay. There are some interesting-looking memory patches for 2.7, but it’s too early to measure the specifics yet…

You’re likely also noticing diminishing returns here - 2.1 had a 32% speed gain, while I’m acting amazed at 2.6.0 getting an extra 6% (after multiplying - 6% relative to 2.0 is the same as 5% relative to 2.3.4 - performance math is a bit funny.) I don’t think we’re going to see a raw, non-JITted 10% boost on both of 2.7 and 2.8. And 10% twice would still only get us to around 208% for Ruby 2.8, even with funny performance math.

Overall, JIT is our big hope for achieving a 300% in the speed column in time for Ruby 3.0. And JIT hasn’t paid off this year for RRB, though we have high hopes for next year. There are also some special-case speedups like Guilds, but those will only help in certain cases - and RRB doesn’t look like one of those cases.

[1] There’s a small chance that I was unlucky when I ran this a couple of times with the release 2.6 and it just looked like it was the same speed as the prerelease. Or the way I did this in lots of small chunks (2.5.0 vs later 2.5 versus 2.6 preview vs later 2.6) hid a noticeable speedup because I was measuring too many small pieces? Or that I was significantly unlucky both times I ran this benchmark, more recently. It seems unlikely that the request-speed graphs I saw for 2.6 result in a 5% faster throughput - not least because I checked throughputs before, too, even though I graphed request speeds in those blog posts.

Benchmarking Hongli Lai's New Patch for Ruby Memory Savings

Recently, Hongli Lai of Phusion Passenger fame, has been looking at how to reduce CRuby’s memory usage without going straight to jemalloc. I think that’s an admirable goal - especially since you can often combine different fixes with good results.

When people have an interesting Ruby speedup they’d like to try out, I often offer to benchmark it for them - I’m trying to improve our collective answer to the question, “does this make Rails faster?”

So: let’s examine Hongli’s fix, benchmark it, and see what we think of it!

The Fix

Hongli has suggested a specific fix - he mentioned it to me, and I tested it out. The basic idea is to occasionally use malloc_trim to free additional blocks of memory that would otherwise not be returned to the OS.

Specifically: in gc_start(), near the end, just after the gc_marks() call, he suggests that you can call:

if(do_full_mark) { malloc_trim(0) }

This will take extra CPU cycles to trim away memory we know we’ll have to get rid of - but only when doing a “full mark”, part of Ruby’s mark/sweep garbage collection. The idea is to spend extra CPU cycles to reduce memory usage. He also suggested that you can skip the “only on a full-mark pass” part of it, and just call malloc_trim(0) every time. That might divide the work over more iterations for more even performance, but might cost overall performance.

Let’s call those variation 1 (only trim on full-mark), variation 2 (trim on every GC, full-mark or not) and baseline (released Ruby 2.6.0.)

(Want to know more about Ruby’s GC and what the pieces are? I gave a talk at RubyKaigi in 2018 on that.)

Based on the change to Ruby’s behavior, I’ll refer to this as the “trim-on-full-mark” patch. I’m open to other names. It is, in any case, a very small patch in lines of code. Let’s see how the effect looks, though!

The Trial

Starting from released Ruby 2.6.0, I tested “plain vanilla” Ruby 2.6.0 and the two variations using Rails Ruby Bench. For those of you just joining us, that means running a Rails app server (including database and Redis) on a dedicated m4.2xlarge EC2 instance, with everything running entirely on-instance (no network) for stability reasons. For each “batch,” RRB generates (in this case) 30,000 pseudorandom HTTP requests against a copy of Discourse running on a large Puma setup (10 processes, 60 threads) and sees how fast it can process them all. Other than having only small, fast database requests, it’s a pretty decent answer to the question, “how fast can Rails process HTTP requests on a big EC2 instance?”

As you may recall from my jemalloc speed testing, running 10 large Rails servers, even on a big EC2 instance, simply consumes all the memory. You won’t see a bunch of free memory sitting around because one server or another would take it. Instead, using less memory will manifest as faster request times and higher throughputs. That’s because more memory can be used for caching, or for less-frequent garbage collection. It won’t be returned to the OS.

This trial used 15 batches of 30,000 requests for each variant (V1, V2, baseline.) That won’t catch tiny, subtle differences (say 0.25%), but it’s pretty good for rough “does this work?” checks. It’s also very representative of a fairly heavy Rails workload.

I calculated median, standard deviation and so on then realized: look, it’s 15 batches. These are all approximations for eyeballing your data points and saying, “is there a meaningful difference?” So, look below for the graph. Looking at it, there does appear to be a meaningful difference between released Ruby 2.6 (orange) and the two variations. I do not see a meaningful difference between Variation 1 and Variation 2. Maybe one has slightly more predictable response time than the other? Maybe no? If there’s a significant performance difference here between V1 and V2, it would want more samples to be able to see it.

The Y axis is requests/second over the 30k requests. The X axis is Rand(0.0, 1.0). The Y axis does not start at zero, so this is not a huge difference.

The Y axis is requests/second over the 30k requests. The X axis is Rand(0.0, 1.0). The Y axis does not start at zero, so this is not a huge difference.

Hongli points out that this article gives some excellent best practices for benchmarking. RRB isn’t perfect according to its recommendations — for instance, I don’t run the CPU scheduler on a dedicated core or manually set process affinity with cores. But I think it rates pretty decently, and I think this benchmark is giving uniform enough results here, in simple enough circumstances, to trust the result.

Based on both eyeballing the graph above and using a calculator on my values, I’d call that about 1% speed difference. It appears to be about three standard deviations of difference between baseline (released 2.6) and either variation. So it appears to be a small but statistically significant result.

That’s good, if it holds for other workloads - 1 line of changed code for a 1% speedup is hard to complain about.

The Fix, More Detail

So… What does this really do? Is it really simple and free?

Normally, Ruby can only return memory to the OS if the blocks are at the end of its address space. It checks it occasionally, and returns blocks it if it can. That’s a very CPU-cheap way to handle it, which makes it a good default in many cases. But it winds up retaining more memory because freed blocks in the middle can only be reused by your Ruby process, not returned for a different process to use. So mostly, long-running Ruby processes expand up to a size with some built-in waste (“fragmentation”) and then stay that big.

With Hongli’s change, Ruby scans all of memory on certain garbage collections (Variant 1) or all garbage collections (Variant 2) and frees blocks of memory that aren’t at the end of its memory space.

The function being called, malloc_trim, is part of GLibC’s memory allocator. So this won’t directly stack with jemalloc, which doesn’t export the exact same interface, and handles freeing differently. My previous results with jemalloc suggest that this isn’t enough, by itself, to bring GLibC up to jemalloc’s level. Jemalloc already frees more memory to the OS than GLibC, and can be tuned with the lg_dirty_mult option to release even more aggressively. I haven’t timed different tunings of jemalloc, though.

A Possible Limitation

This seems like a good patch to me, but just to mention a problem it could have: the malloc_trim API is GLibC-specific. This would need to be #ifdef’d out when Ruby is compiled with jemalloc. The core team may not be thrilled to add extra allocator-specific behavior, even if it’s beneficial.

I don’t see this as a big deal, but I’m not the one who gets to decide.

Conclusions

I think Hongli’s patch shows a lot of promise. I’m curious how it compares on smaller benchmarks. But especially for Variation 1 (only on full-mark GC), I don’t think it’ll be very different — most small benchmarks do very few full-mark garbage collections. Most do very few garbage collections, period.

So I think this is a free 1% speed boost for large, memory-constrained Rails applications, and that it doesn’t hurt anybody else. I’ll look forward to the results on smaller benchmarks and more CPU-bound Ruby code.

Ruby Register Transfer Language - But How Fast Is It on Rails?

I keep saying that one of the first Ruby performance questions people ask is, “will it speed up Rails?” I wrote a big benchmark to answer that question - short version: I run a highly-concurrent Discourse server to max out a large, dedicated EC2 instance and see how fast I can run many HTTP requests through it, with requests meant to simulate very simple user access patterns.

Recently, the excellent Vladimir Makarov wrote about trying to alter CRuby to use register transfer instead of a stack machine for passing values around in its VM. The article is very good (and very technical.) But he points out that using registers isn’t guaranteed to be a speedup by itself (though it can be) and it mostly enables other optimizations. Large Rails apps are often hard to optimize. So then, what kind of speed do we see with RTL for Rails Ruby Bench, the large concurrent Discourse benchmark?

JIT

First, an aside: Vlad is the original author of MJIT, the JIT implementation in Ruby 2.6. In fact, his RTL work was originally done at the same time as MJIT, and Takashi Kokubun separated the two so that MJIT could be separately integrated into CRuby.

In a moment, I’m going to say that I did not speed-test the RTL branch with JIT. That’s a fairly major oversight, but I couldn’t get it to run stably enough. JIT tends to live or die on longer-term performance, not short-lived processes, and the RTL branch, with JIT enabled, crashes frequently on Rails Ruby Bench. It simply isn’t stable enough to test yet.

Quick Results

Since Vlad’s branch of Ruby is based (approximately) on CRuby 2.6.0, it seems fair to test it against 2.6.0. I used a recent commit of Vlad’s branch. You may recall that 2.6.0 JIT doesn’t speed up Rails, or Rails Ruby Bench, yet either. So the 2.6-with-JIT numbers below are significantly slower than JITless 2.6. That’s the same as when I last timed it.

Each graph line below is based on 30 runs, with each using 100,000 HTTP requests plus 100 warmup requests. The very flat, low-variance lines you see below are for that reason - and also that newer Ruby has very even, regular response times, and I use a dedicated EC2 instance running a test that avoids counting network latency.

Hard to tell those top two apart, isn’t it?

Hard to tell those top two apart, isn’t it?

You’ll notice that it’s very hard to tell the RTL and stack-based (normal) versions apart, though JIT is slower. We can zoom in a little and chop the Y axis, but it’s still awfully close. But if you look carefully… it looks like the RTL version is very slightly slower. I haven’t shown it on this graph, but the variance is right on the border of statistical significance. So RTL may, possibly, be just slightly slower. But there’s at least a fair chance (say one in three?) that they’re exactly the same and it’s a measurement artifact, even with this very large number of samples.

rtl_vs_26_closer.png

Conclusions

I often feel like Rails Ruby Bench is unfair to newer efforts in Ruby - optimizing “most of” Ruby’s operations is frequently not enough for good RRB results. And its dependencies are extensive. This is a case where a promising young optimization is doing well, but — in my opinion — isn’t ready to roll out on your production servers yet. I suspect Vlad would agree, but it’s nice to put numbers to it. However, it’s also nice to see that his RTL code is mature enough to run non-JITted with enough stability for very long runs of Rails Ruby Bench. That’s a difficult stability test, and it held up very well. There were no crashes without supplying the JIT parameter on the command line.

Microbenchmarks vs Macrobenchmarks (i.e. What's a Microbenchmark?)

Sometimes you need to measure a few Rubies…

Sometimes you need to measure a few Rubies…

I’ve mentioned a few times recently that something is a “microbenchmark.” What does that mean? Is it good or bad?

Let’s talk about that. Along the way, we’ll talk about benchmarks that are not microbenchmarks and how to pick a scale/size for a specific benchmark.

I talk about this because I write benchmarks for Ruby. But you may prefer to read it because you use benchmarks for Ruby - if you read the results or run them. Knowing what can go wrong in benchmarks is like learning to spot bad statistics: it’s not easy, but some practice and a few useful principles can help you out a lot.

Microbenchmarks: Definition and Benefits

The easiest size of benchmark to talk about is a very small benchmark, or microbenchmark.

The Ruby language has a bunch of microbenchmarks that ship right in the language - a benchmarks directory that’s a lot like a test directory, but for speed. The code being timed is generally tiny, simple and specific.

Each one is a perfect example of a microbenchmark: it tests very little code, sometimes just a single Ruby operation. If you want to see how fast a particular tiny Ruby operation is (e.g. passing a block, a .each loop, an Integer plus or a map) a microbenchmark can measure that very exactly while measuring almost nothing else.

A well-tuned microbenchmark can often detect very tiny changes, especially when running many iterations per step (see “Writing Good Microbenchmarks” below.) If you see a result like “this optimization speeds up Ruby loops by half of one percent", you’re pretty certainly looking at the result of a microbenchmark.

Another advantage of running just one small piece of code is that it’s usually easy and fast. You don’t do much setup, and it doesn’t usually take long to run.

Microbenchmarks: Problems

A good microbenchmark measures one small, specific thing. This strength is also a weakness. If you want to know how fast Ruby is overall, a microbenchmark won’t tell you much. If you get lots of them together (example: Ruby’s benchmarks directory) then it still won’t tell you much. That’s because they’re each written to test one feature, but not set up according to which features are used the most, or in what combination. It’s like reading the dictionary - you may have all the words, but a normal block of text is going to have some words a lot (“a,” “the,” “monkey”) and some words almost never (“proprioceptive,” “batrachian,” “fustian.”)

In the same way, running your microbenchmarks directory is going to overrepresent uncommon operations (e.g. passing a block by typecasting something to a proc and passing via ampersand; dynamically adding a module as a refinement) and is going to underrepresent common operations (method calls, loops.) That’s because if you run about the same number of each, that’s not going to look much like real Ruby code — real Ruby code uses common operations a lot, and uncommon operations very little.

A microbenchmark isn’t normally a good way to test subtle, pervasive changes since it’s measuring only a short time at once. For instance, you don’t normally test garbage collector or caching changes with a microbenchmark. To do so you’d have to collect a lot of different runs and check their behavior overall… which quickly turns into a much larger, longer-term benchmark, more like the larger benchmarks I describe later in this article. It would have completely different tradeoffs and would need to be written differently.

Sometimes a tiny, specific magnifier is the right tool

Sometimes a tiny, specific magnifier is the right tool

Microbenchmarks are excellent to check a specific optimization, since they only run that optimization. They’re terrible to get an overall feel for a speedup, because they don’t run “typical” code. They also usually just run the one operation, often over and over. This is also not what normal Ruby code tends to do, and it affects the results.

Lastly, a microbenchmark can often look deceptively simple. A tiny confounding factor can spoil your entire benchmark without you noticing. Say you were testing the speed of a “rescue nil” clause and your newer Ruby version didn’t just rescue faster — it also incorrectly failed to throw the exception you wanted. It would be easy for you to say “look how fast this benchmark is!” and never realize your mistake.

Writing Good Microbenchmarks

If you’re writing or evaluating a microbenchmark, keep this in mind: your test harness needs to be very simple and very fast. If your test takes 15 milliseconds for one whole run-through, 3 milliseconds of overhead is suddenly a lot. Variable overhead, say between 1 and 3 milliseconds, is even worse - you can’t usually subtract it out and you don’t want to separately measure it.

What you want in a test harness looks like benchmark_ips or benchmark_driver. You want it to be simple and low-overhead. Often it’s a good idea to run the operation many times - perhaps 100 or 1000 times per run. That means you’ll get a very accurate average with very low overhead — but you won’t see how much variation happens between runs. So it’s a good method if you’re testing something that basically always takes about equally long.

Since microbenchmarks are very speed-dependent, try to avoid VMs or tools like Docker which can add variation to your results. If you can run your microbenchmark outside a framework (e.g. Rails) then you usually should. In general, simplify by removing everything you can.

You may also want to run warmup iterations - these are extra, optional benchmark runs before you start timing the result. If you want to know the steady-state performance of a benchmark, give it lots of warmup iterations so you’ll find out how fast it is after it’s been running awhile. Or if it’s an operation that is usually done only a few times, or occasionally, don’t give it warmup at all and see how it does from a cold start.

Warmup iterations can also avoid one-time performance costs, such as class loading in Java or reading a rarely-used file from disk. The very first time you do that it will be slow, but then it will be fast every other time - even a single warmup iteration can often make those costs nearly zero. That’s either very good if you don’t want to measure them, or very bad if you do.

Since microbenchmarks are usually meant to measure a specific operation, you’ll often want to turn off operations that may confound it - for instance, you may want to garbage collect just before the test, or even turn off GC completely if your language supports it.

Keep in mind that even (or especially!) a good microbenchmark will give chaotic results as situations change. For instance, a microbenchmark won’t normally get slightly faster every Ruby version. Instead, it will leap forward by a huge amount when a new Ruby version optimizes its specific operation… And then do nothing, or even get slower, in between. The long-term story may say “Ruby keeps getting faster!”, but if you tell that story entirely by how fast passing a symbol as a block is, you’ll find that it’s an uneven story of fits and starts — even though, in the long term, Ruby does just keep getting faster.

You can find some good advice on best practices and potential problems of microbenchmarking out on the web.

Macrobenchmarks

Okay, if those are microbenchmarks, what’s the opposite? I haven’t found a good name for these, so let’s call them macrobenchmarks.

Rails Ruby Bench is a good example of a macrobenchmark. It uses a large, real application (called Discourse) and configures it with a lot of threads and processes, like a real company would host it. RRB loads it with test data and generates real-looking URLs from multiple users to simulate real-world application performance.

In many ways, this is the mirror image opposite of a microbenchmark. For instance:

  • It’s very hard to see how one specific optimization affects the whole benchmark

  • A small, specific optimization will usually be too small to detect

  • Configuring the dependencies is usually hard; it’s not easy to run

  • There’s a lot of variation from run to run; it’s hard to get a really exact figure

  • It takes a long time for each run

  • It gives a very good overview of current Ruby performance

  • It’s a great way to see how Ruby “tuning” works

  • It’s usually easy to see a big mistake, since a sudden 30%+ shift in performance is nearly always a testing error

  • “Telling a story” is easier, because the overview at every point is more accurate; less chaotic results

In other words, it’s good where microbenchmarks are bad, and bad where they’re good. You’ll find that a language implementor (e.g. the Ruby Core Team) wants more microbenchmarks so they can see the effects of their work. On the other hand, a random Ruby developer probably only cares about the big picture (“how fast is this Ruby version? Does the Global Method Cache make much speed difference?”) Large and small benchmarks are for different audiences.

If a good microbenchmark is judged by its exactness and low variation, a good macrobenchmark is judged by being representative of some workload. “Yes, this is a typical Rails app” would be high praise for a macrobenchmark.

Good Practices for Macrobenchmarks

2019-microbenchmarks-macro.png

A high-quality macrobenchmark is different than a high-quality microbenchmark.

While a microbenchmark cannot, and usually should not, measure large systemic effects like garbage collection, a good macrobenchmark nearly always wants to — and usually needs to. You can’t just turn off garbage collection and run a large, long-term benchmark without running out of memory.

In a good microbenchmark you turn off everything nonessential. In a good macrobenchmark you turn off everything that is not representative. If garbage collection matters to your target audience, you should leave it on. If your audience cares about startup behavior, be careful about too many warmup iterations — they can erase the initial startup iterations’ effects.

This requires knowing (or asking, or assuming, or testing) a lot about what your audience wants - you’ll need to figure out what’s in and what’s out. In a microbenchmark, one assumes that your benchmark will test one tiny thing and developers can watch or ignore it, depending. In a macrobenchmark, you’ll have a lot of different things going on. Your responsibility is to communicate to your audience what you’re checking. Then, be sure to check what you said you would.

For instance, Rails Ruby Bench attempts to be “a mid-sized typical Rails application as deployed by a small but successful startup.” That helps a lot to define the audience and operations. Should RRB test warmup iterations? Only a little - mostly it’s about steady-state performance after warmup is finished. Early performance is mostly important to represent how quickly you can edit/debug the application. Should RRB test garbage collection? Yes, absolutely, that’s an important performance consideration to the target audience. Should it test Redis performance? Only as far as necessary for actions. The target audience doesn’t directly care about Redis except as it concerns overall performance.

A good macrobenchmark is defined by the way you choose, implement and communicate the simulated workload.

Conclusions: Choosing Your Benchmark Scale

Whether you’re writing a benchmark or looking for one, a big question is “how big should the benchmark be?” A very large benchmark will be less exact and harder to run for yourself. A tiny benchmark may not tell you what you care about. How big a benchmark should you look for? How big a benchmark should you write?

The glib answer is “exactly big enough and no bigger.” Not very useful, is it?

Here’s a better answer: who’s your target audience? It’s okay if the answer is “me” or “me and my team” or “me and my company.”

A very specific audience usually wants a very specific benchmark. What’s the best benchmark for “you and your team?” Your team’s app, usually, run in a new Ruby version or with specific settings. If what you really care about is “how fast will our app be?” then figuring out some generalized “how fast is Ruby with these settings?” benchmark is probably all work and no benefit. Just test your app, if you can.

If your answer is, “to convince the Internet!” or “to show those Ruby haters!” or even “to show those mindless Ruby fans!” then you’re probably on the pathway to a microbenchmark. Keep it small and you can easily “prove” that a particular operation is very fast (or very slow.) Similarly, if you’re a vendor selling something, microbenchmarks are a great, low-effort way to show that your doodad is 10,000% faster than normal Ruby. Pick the one thing you do really fast and only measure that. Note that just because you picked a specific audience doesn’t mean they want to hear what you have to say. So, y’know, have fun with that.

That’s not to say that microbenchmarks are bad — not at all! But they’re very specific, so make sure there’s a good specific reason for it. Microbenchmarks are at their best when they’re testing a specific small function or language feature. That’s why language implementors use so many of them.

A bigger benchmark like RRB is more painful. It’ll be harder to set up. It’ll take longer to run. You’ll have to control for a lot of factors. I only run a behemoth like that regularly because AppFolio pays the server bills (thank you, AppFolio!) But the benefit is that you can answer a larger, poorly-defined question like, “about how fast is a big Rails application?” There’s also less competition ;-)

Test Ruby's Speed with Rails and Rack "Hello, World" Apps

As I continue on the path to a new benchmark for Ruby speed, one important technique is to build a little at a time, and add in small pieces. I’m much more likely to catch a problem if I keep adding, checking and writing about small things.

As a result, you get a nice set of blog posts talking about small, specific aspects of speed testing. I always think this kind of thing is fascinating, so perhaps you will too!

Two weeks ago, I wrote about a simple speed-test - have a Rails 4.2 route return a static string, as a kind of Rails “Hello, World” app. Rack’s well-known “Hello, World” app is even simpler. On the way to a more interesting Rails-based Ruby benchmark, let’s speed test those two, and see how the new test infrastructure holds up!

(Scroll down for speed graphs by Ruby version.)

ApacheBench and Load-Test Clients

I always felt a little self-conscious about just using RestClient and Ruby for my load-testing for Rails Ruby Bench. But I like writing Ruby, you know? And as a load test gets more complicated, it’s nice to use a real, normal programming language instead of a test specification language. But then, perhaps there’s virtue in using all this software that other people write.

So I thought I’d give ApacheBench a try.

ApacheBench is wonderfully simple, which is nice. It handles concurrent requests. It’s fast. It gives very stable results.

I initially used its CSV output format, which automatically bins all requests by speed. It only tells you, for a given percentage of your requests, how slow the slowest of them was. You get 100 numbers, no matter how many requests, which each represent a “slowest in this percentage of requests” measurement. It’s… okay. I used it last time.

Of course, it also uses either of two weird output formats. And unfortunately, the really detailed format (GNUplot) rounds everything to the nearest second (for start time) or millisecond (for durations.) For small, fast requests that’s not very exact. So I can either get my data pre-histogrammed (can’t check individual requests) or very low-precision.

I may be switching back from ApacheBench to RestClient-or-something again. We’ll see.

Making Lemonade

I gathered a fair bit of data, in fact, where the processing time was all just “1” - that is, it took around 1 millisecond of processing time to return a value. That’s nice, but it’s not very exact. Graphing that would be 1) very boring and 2) not very informative.

And then I realized I could graph throughputs! While each request was fast enough to be low-precision in the file, I still ran thousands of them in a row. And with that, I had the data I wanted, more or less.

So! Two weeks ago I tried using ApacheBench’s CSV format and got stable, simple, hard-to-fathom results. This week I got somewhat-inaccurate results that I could still measure throughputs from. And I got closer to the kind of results I expected, so that’s nice.

Specifically, here is this week’s results for Rails “Hello, World”:

None of this uses JIT for this benchmark. You should expect JIT to be a bit slower than no JIT on 2.6 for Rails, though.

None of this uses JIT for this benchmark. You should expect JIT to be a bit slower than no JIT on 2.6 for Rails, though.


Again, keep in mind that this is a microbenchmark - checking a small, very specific set of functionality which means you may see somewhat chaotic results from Ruby version to Ruby version. But this is a pretty nice graph, even if it may be partly by chance!

Great! Rack is even more of a microbenchmark because the framework is so simple. What does that look like?

The Y axis here is requests/second. But keep in mind this is 100% single-thread single-CPU. We could have much higher throughput with some concurrency.

The Y axis here is requests/second. But keep in mind this is 100% single-thread single-CPU. We could have much higher throughput with some concurrency.

That’s similar, with even more of a dip between 2.0 and late 2.3. My guess is that the apps are so simple that we’re not seeing any benefit from the substantial improvements to garbage collection between those versions. This is a microbenchmark, and it definitely doesn’t test everything it could. And that’s why you’ll see a long series of these blog posts, testing one or two interesting factors at a time, as the new code slowly develops.

Conclusions

This isn’t a post with many far-reaching conclusions yet. This benchmark is still very simple. But here are a few takeaways:

  • ApacheBench file format isn’t terribly exact, so there will be some imprecision with it

  • 2.6 did gain some speed for Rails, but RRB is too heavyweight to really notice

  • Quite a lot of the speed gain between 2.0 and 2.3 didn’t help really lightweight apps

  • Rails 2.4 holds up pretty well as a way to “historically” speed-test Rails across Rubies

See you in two weeks!